Overview
The .NET MAUI line chart represents and visualizes time-dependent data to show trends at equal intervals. It supports numeric, category, and date-time axes, and works well with large amounts of data with animation, zooming, and panning.
.NET MAUI line chart documentation

Key features
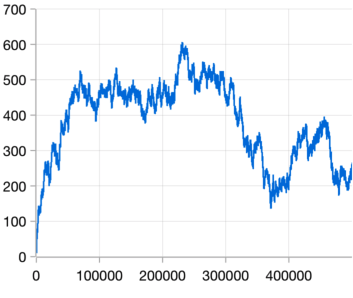
Fast line
The fast line chart is a special kind of line chart that can smoothly render a data collection with a large number of data points.
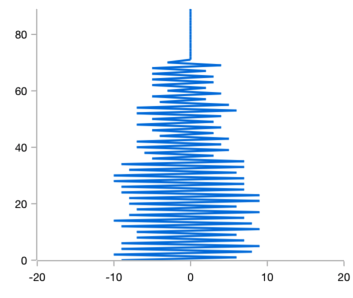
Vertical line chart
The line chart can be transposed vertically to view data from a different perspective.
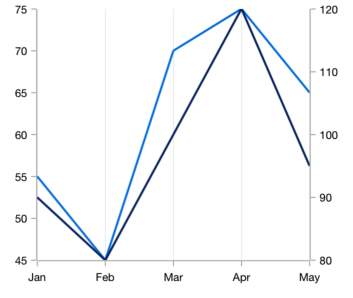
Multiple axes
Use multiple axes to plot different data sets along two or more axes having different data points and values.
Code example
Easily get started with line chart using a few simple lines of XAML and C# code, as demonstrated below.
<ContentPage xmlns="http://schemas.microsoft.com/dotnet/2021/maui"
        xmlns:x="http://schemas.microsoft.com/winfx/2009/xaml"
        x:Class="ChartExample.MainPage"
        xmlns:local="using:ChartExample"
        xmlns:chart="clr-namespace:Syncfusion.Maui.Charts;assembly=Syncfusion.Maui.Charts">

    <Grid>
        <chart:SfCartesianChart HorizontalOptions="FillAndExpand" VerticalOptions="FillAndExpand">
            <!--Setting BindingContext-->
            <chart:SfCartesianChart.BindingContext>
                <local:ViewModel/>
            </chart:SfCartesianChart.BindingContext>

            <!--Initialize the horizontal axis for the .NET MAUI Cartesian Chart-->
            <chart:SfCartesianChart.XAxes>
                <chart:CategoryAxis/>
            </chart:SfCartesianChart.XAxes>

            <!--Initialize the vertical axis for the .NET MAUI Cartesian Chart-->
            <chart:SfCartesianChart.YAxes>
                <chart:NumericalAxis/>
            </chart:SfCartesianChart.YAxes>

            <!--Adding LineSeries to the .NET MAUI Cartesian Chart-->
            <chart:LineSeries
                        ItemsSource="{Binding Data}"
                        XBindingPath="Month"
                        YBindingPath="Target">
            </chart:LineSeries>
        </chart:SfCartesianChart>
    </Grid>
</ContentPage>
public class Model
{
public string Month { get; set; }
public double Target { get; set; }
public Model(string xValue, double yValue)
{
Month = xValue;
Target = yValue;
}
}
public class ViewModel
{
public ObservableCollection<Model> Data { get; set; }
public ViewModel()
{
Data = new ObservableCollection<Model>()
{
new Model("Jan", 50),
new Model("Feb", 70),
new Model("Mar", 65),
new Model("Apr", 57),
new Model("May", 48),
};
}
}Learning resources

Explore the .NET MAUI line chart example from GitHub to learn how to render and configure charts.

