Overview
The .NET MAUI bubble chart visualizes data in three dimensions similar to a scatter chart. A data point’s position is determined based on x- and y-values and the radius of its circle is determined by a size value. You can create beautiful, animated, real-time and high-performance bubble charts that also support interactive features such as zooming and panning, trackball, tooltip, and selection.

Key features
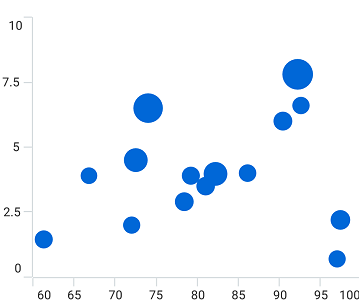
Bubble radius
Control the minimum and maximum radii of the overall bubble series.
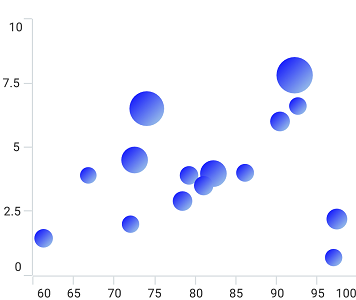
Gradient
Apply gradient colors to visualize data in different colors, thus improving the readability and appearance of the MAUI bubble chart.
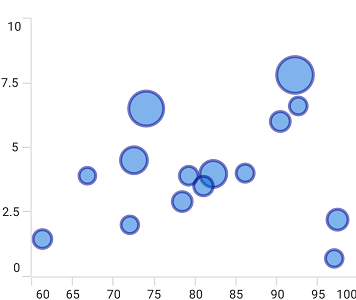
UI customization
Customize the color and border of the MAUI bubble chart using built-in APIs to make it visually distinct.
Code example
<ContentPage xmlns="http://schemas.microsoft.com/dotnet/2021/maui"
        xmlns:x="http://schemas.microsoft.com/winfx/2009/xaml"
        x:Class="ChartExample.MainPage"
        xmlns:local="using:ChartExample"
        xmlns:chart="clr-namespace:Syncfusion.Maui.Charts;assembly=Syncfusion.Maui.Charts">

    <Grid>
        <chart:SfCartesianChart HorizontalOptions="FillAndExpand" VerticalOptions="FillAndExpand">
            <!--Setting BindingContext-->
            <chart:SfCartesianChart.BindingContext>
                <local:ViewModel/>
            </chart:SfCartesianChart.BindingContext>

            <!--Initialize the horizontal axis for the .NET MAUI Cartesian Chart.-->
            <chart:SfCartesianChart.XAxes>
                <chart:CategoryAxis/>
            </chart:SfCartesianChart.XAxes>

            <!--Initialize the vertical axis for the .NET MAUI Cartesian Chart.-->
            <chart:SfCartesianChart.YAxes>
                <chart:NumericalAxis/>
            </chart:SfCartesianChart.YAxes>

            <!--Adding Bubble Series to the .NET MAUI Cartesian Chart.-->
            <chart:BubbleSeries
                        ItemsSource="{Binding Data}"
                        XBindingPath="Month" SizeValuePath="Size"
                        YBindingPath="Target">
            </chart:BubbleSeries>
        </chart:SfCartesianChart>
    </Grid>
</ContentPage>
public class Model
{
public string Month { get; set; }
public double Target { get; set; }
public double Size { get; set; }
public Model(string xValue, double yValue, double size)
{
Month = xValue;
Target = yValue;
Size = size;
}
}
public class ViewModel
{
public ObservableCollection<Model> Data { get; set; }
public ViewModel()
{
Data = new ObservableCollection<Model>()
{
new Model("Jan",7, 2),
new Model("Feb",8, 3),
new Model("Mar",12, 5),
new Model("Apr",16, 7),
new Model("May",20, 11),
};
}
}Learning resources


.NET MAUI Bubble Chart User Guide
Learn about the options available to customize the .NET MAUI bubble chart.
