Overview
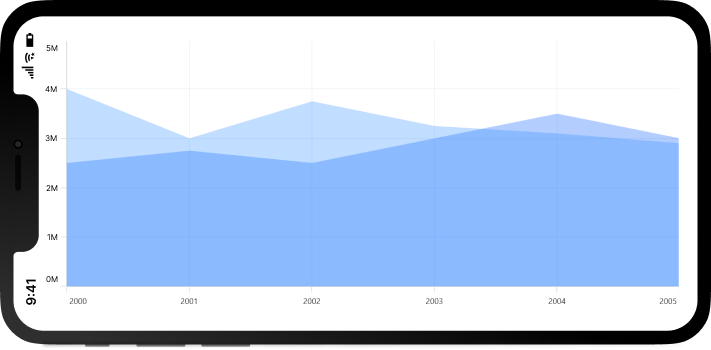
The .NET MAUI area chart is like a line chart that represents time-dependent data and shows it at equal intervals, but it fills the area created by the line. This type of chart can be configured with a numerical, category, or date-time axis. It supports zooming, scrolling, tooltip, and selection.
.NET MAUI Area Chart documentation
Key Features
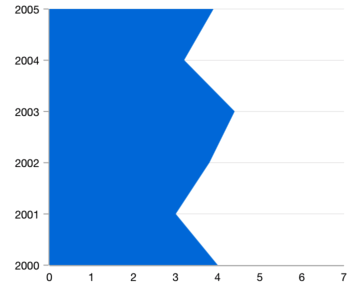
Vertical area chart
Rotate the chart to plot data vertically and view it from a different perspective.
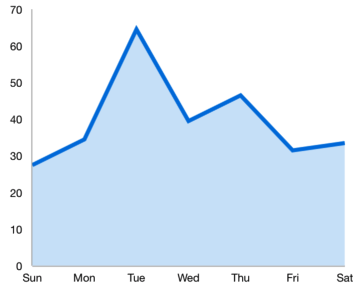
UI styling
Customize the color and border of the chart using built-in APIs to make it visually unique.

Multiple axes
Use multiple axes to plot different data sets that significantly vary from one another.
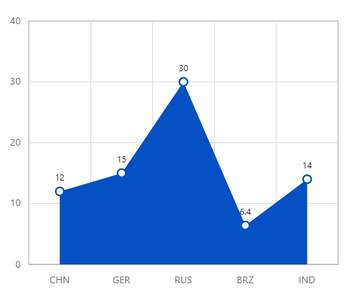
Data labels
Data labels display information about data points. Customize the labels’ foreground, border, and background. Rotate a data label by a specified angle.
Code example
<ContentPage xmlns="http://schemas.microsoft.com/dotnet/2021/maui"
        xmlns:x="http://schemas.microsoft.com/winfx/2009/xaml"
        x:Class="ChartExample.MainPage"
        xmlns:local="using:ChartExample"
        xmlns:chart="clr-namespace:Syncfusion.Maui.Charts;assembly=Syncfusion.Maui.Charts">

    <Grid>
        <chart:SfCartesianChart HorizontalOptions="FillAndExpand" VerticalOptions="FillAndExpand">
            <!--Setting BindingContext-->
            <chart:SfCartesianChart.BindingContext>
                <local:ViewModel/>
            </chart:SfCartesianChart.BindingContext>

            <!--Initialize the horizontal axis for the .NET MAUI Cartesian Chart.-->
            <chart:SfCartesianChart.XAxes>
                <chart:CategoryAxis/>
            </chart:SfCartesianChart.XAxes>

            <!--Initialize the vertical axis for the .NET MAUI Cartesian Chart.-->
            <chart:SfCartesianChart.YAxes>
                <chart:NumericalAxis/>
            </chart:SfCartesianChart.YAxes>

            <!--Adding Area Series to the .NET MAUI Cartesian Chart.-->
            <chart:AreaSeries
                        ItemsSource="{Binding Data}"
                        XBindingPath="Month"
                        YBindingPath="Target">
            </chart:AreaSeries>
        </chart:SfCartesianChart>
    </Grid>
</ContentPage>
public class Model
{
public string Month { get; set; }
public double Target { get; set; }
public Model(string xValue, double yValue)
{
Month = xValue;
Target = yValue;
}
}
public class ViewModel
{
public ObservableCollection<Model> Data { get; set; }
public ViewModel()
{
Data = new ObservableCollection<Model>()
{
new Model("Jan", 50),
new Model("Feb", 70),
new Model("Mar", 65),
new Model("Apr", 57),
new Model("May", 48),
};
}
}Learning resources


.NET MAUI Area Chart User Guide
Learn more about the available options to customize .NET MAUI area charts.
