Overview
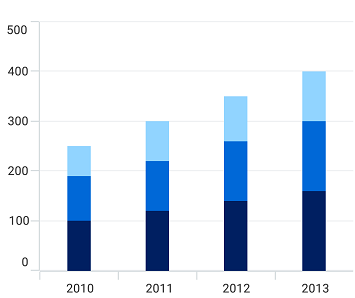
The .NET MAUI Stacked Column Chart visualizes data with y-values stacked in the order of the series. It shows the relationship between individual values and the total sum of the points. You can create beautiful, animated, real-time, high-performance stacked column charts that also support interactive features such as zooming and panning, trackball, tooltip, and selection.

Key features
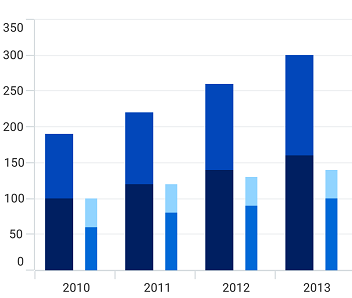
Stacking group
Group a series with another series using the grouping name in the chart. Use the GroupingName property to divide datasets into multiple stacks.
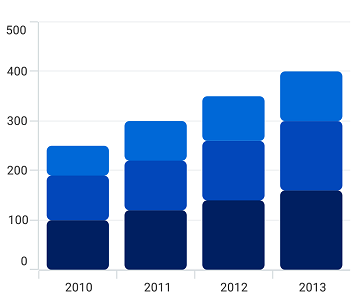
Rounded corners
Modernize the UI by applying rounded corners to the .NET MAUI Stacked Column chart.
Spacing and width
The .NET MAUI Stacked Column chart provides an option to customize the spacing between two rectangles, which increases or decreases the width of the column.
Code example
<ContentPage xmlns="http://schemas.microsoft.com/dotnet/2021/maui"
        xmlns:x="http://schemas.microsoft.com/winfx/2009/xaml"
        x:Class="ChartExample.MainPage"
        xmlns:local="using:ChartExample"
        xmlns:chart="clr-namespace:Syncfusion.Maui.Charts;assembly=Syncfusion.Maui.Charts">

    <Grid>
        <chart:SfCartesianChart HorizontalOptions="FillAndExpand" VerticalOptions="FillAndExpand">
            <!--Setting BindingContext-->
            <chart:SfCartesianChart.BindingContext>
                <local:ViewModel/>
            </chart:SfCartesianChart.BindingContext>

            <!--Initialize the horizontal axis for the .NET MAUI Cartesian Chart.-->
            <chart:SfCartesianChart.XAxes>
                <chart:CategoryAxis/>
            </chart:SfCartesianChart.XAxes>

            <!--Initialize the vertical axis for the .NET MAUI Cartesian Chart.-->
            <chart:SfCartesianChart.YAxes>
                <chart:NumericalAxis/>
            </chart:SfCartesianChart.YAxes>

            <!--Adding Stacked Column Series to the .NET MAUI Cartesian Chart.-->
            <chart:SfCartesianChart.Series>
                <chart:StackingColumnSeries
                            ItemsSource="{Binding Data}"
                            XBindingPath="Month"
                            YBindingPath="Target">
                </chart:StackingColumnSeries>
                <chart:StackingColumnSeries
                            ItemsSource="{Binding Data}"
                            XBindingPath="Month"
                            YBindingPath="High">
                </chart:StackingColumnSeries>
                <chart:StackingColumnSeries
                            ItemsSource="{Binding Data}"
                            XBindingPath="Month"
                            YBindingPath="Low">
                </chart:StackingColumnSeries>
            </chart:SfCartesianChart.Series>
        </chart:SfCartesianChart>
    </Grid>
</ContentPage>
public class Model
{
public string Month { get; set; }
public double Target { get; set; }
public double High { get; set; }
public double Low { get; set; }
public Model(string xValue, double yValue, double high, double low)
{
Month = xValue;
Target = yValue;
High = high;
Low = low;
}
}
public class ViewModel
{
public ObservableCollection<Model> Data { get; set; }
public ViewModel()
{
Data = new ObservableCollection<Model>()
{
new Model("2010", 100,90,60),
new Model("2011", 120,100,80),
new Model("2012", 140,120,90),
new Model("2013", 160,140,100),
};
}
}Learning resources


.NET MAUI Stacked Column Chart User Guide
Learn available options to customize the .NET MAUI Stacked Column chart.
