Overview
The .NET MAUI 100% stacked column chart displays multiple series of data as stacked columns, ensuring that the cumulative proportion of each stacked element always totals 100%. The y-axis will always render within the range 0–100. You can create beautiful, animated, real-time, and high-performance 100% stacked column charts that also support interactive features such as zooming and panning, trackball, tooltips, and selection.
.NET MAUI 100% stacked column chart documentation

Key features
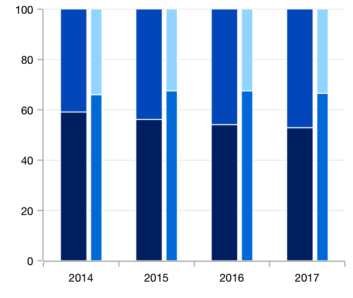
Stacking group
Group a series with another series using the group name in a chart. Group the series with different stacking names separately.
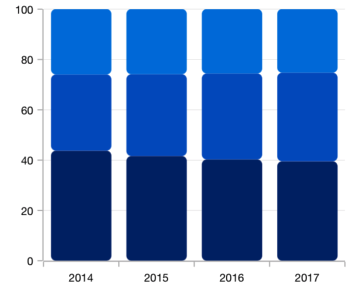
Rounded corners
Modernize the UI by applying rounded corners to the .NET MAUI 100% stacked column chart.
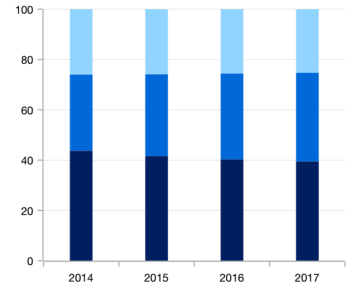
Spacing and width
The .NET MAUI 100% stacked column chart provides an option to customize the spacing between two rectangles, which increases or decreases the width of the column.
Code example
Easily get started with 100% stacked column chart using a few simple lines of XAML and C# code, as demonstrated below.
<ContentPage xmlns="http://schemas.microsoft.com/dotnet/2021/maui"
        xmlns:x="http://schemas.microsoft.com/winfx/2009/xaml"
        x:Class="ChartExample.MainPage"
        xmlns:local="using:ChartExample"
        xmlns:chart="clr-namespace:Syncfusion.Maui.Charts;assembly=Syncfusion.Maui.Charts">

    <Grid>
        <chart:SfCartesianChart HorizontalOptions="FillAndExpand" VerticalOptions="FillAndExpand">
            <!--Setting BindingContext-->
            <chart:SfCartesianChart.BindingContext>
                <local:ViewModel/>
            </chart:SfCartesianChart.BindingContext>

            <!--Initialize the horizontal axis for the .NET MAUI Cartesian Chart.-->
            <chart:SfCartesianChart.XAxes>
                <chart:CategoryAxis/>
            </chart:SfCartesianChart.XAxes>

            <!--Initialize the vertical axis for the .NET MAUI Cartesian Chart.-->
            <chart:SfCartesianChart.YAxes>
                <chart:NumericalAxis/>
            </chart:SfCartesianChart.YAxes>

            <!--Adding 100% Stacked column series to the .NET MAUI Cartesian Chart.-->
            <chart:SfCartesianChart.Series>
                <chart:StackingColumn100Series
                            ItemsSource="{Binding Data}"
                            XBindingPath="Month"
                            YBindingPath="Target">
                </chart:StackingColumn100Series>
                <chart:StackingColumn100Series
                            ItemsSource="{Binding Data}"
                            XBindingPath="Month"
                            YBindingPath="High">
                </chart:StackingColumn100Series>
                <chart:StackingColumn100Series
                            ItemsSource="{Binding Data}"
                            XBindingPath="Month"
                            YBindingPath="Low">
                </chart:StackingColumn100Series>
            </chart:SfCartesianChart.Series>
        </chart:SfCartesianChart>
    </Grid>
</ContentPage>
public class Model
{
public string Month { get; set; }
public double Target { get; set; }
public double High { get; set; }
public double Low { get; set; }
public Model(string xValue, double yValue, double high, double low)
{
Month = xValue;
Target = yValue;
High = high;
Low = low;
}
}
public class ViewModel
{
public ObservableCollection<Model> Data { get; set; }
public ViewModel()
{
Data = new ObservableCollection<Model>()
{
new Model("2010", 100,90,60),
new Model("2011", 120,100,80),
new Model("2012", 140,120,90),
new Model("2013", 160,140,100),
};
}
}Learning resources


.NET MAUI 100% stacked column chart user guide
Learn about all the options available to customize the .NET MAUI 100% stacked column chart.

.NET MAUI 100% stacked column chart API reference
Explore the .NET MAUI 100% stacked column chart APIs.