Overview
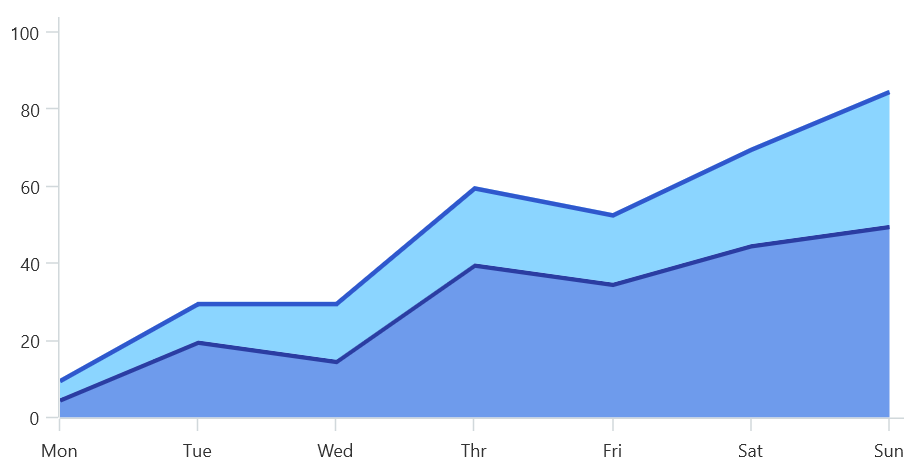
The .NET MAUI Stacked Area Chart visualizes data with y-values stacked one over another in series order. It shows the relationship between individual values to the total sum of the points. You can create beautiful, animated, real-time, high-performance stacked area charts that also support interactive features such as zooming and panning, trackballs, and tooltips.
.NET MAUI Stacked Area Chart documentation

Key features

Data Labels
Data labels display information about data points. Customize the labels’ foreground, border, and background. Rotate a data label by a specified angle.
UI styling
The .NET MAUI Stacked Area chart offers UI customization through built-in APIs for adjusting colors and borders, enhancing its visual appeal with a distinctive look.

Empty or null points
Empty or null data points are elegantly handled in the .NET MAUI stacked area chart.
Code example
<ContentPage xmlns="http://schemas.microsoft.com/dotnet/2021/maui"
        xmlns:x="http://schemas.microsoft.com/winfx/2009/xaml"
        x:Class="ChartExample.MainPage"
        xmlns:local="using:ChartExample"
        xmlns:chart="clr-namespace:Syncfusion.Maui.Charts;assembly=Syncfusion.Maui.Charts">

    <Grid>
        <chart:SfCartesianChart HorizontalOptions="FillAndExpand" VerticalOptions="FillAndExpand">
            <!--Setting BindingContext-->
            <chart:SfCartesianChart.BindingContext>
                <local:ViewModel/>
            </chart:SfCartesianChart.BindingContext>

            <!--Initialize the horizontal axis for the .NET MAUI Cartesian Chart.-->
            <chart:SfCartesianChart.XAxes>
                <chart:CategoryAxis/>
            </chart:SfCartesianChart.XAxes>

            <!--Initialize the vertical axis for the .NET MAUI Cartesian Chart.-->
            <chart:SfCartesianChart.YAxes>
                <chart:NumericalAxis/>
            </chart:SfCartesianChart.YAxes>

            <!--Adding Stacked Area Series to the .NET MAUI Cartesian Chart.-->
            <chart:SfCartesianChart.Series>
                <chart:StackingAreaSeries
                            ItemsSource="{Binding Data}"
                            XBindingPath="Month"
                            YBindingPath="Target">
                </chart:StackingAreaSeries>
                <chart:StackingAreaSeries
                            ItemsSource="{Binding Data}"
                            XBindingPath="Month"
                            YBindingPath="High">
                </chart:StackingAreaSeries>
                <chart:StackingAreaSeries
                            ItemsSource="{Binding Data}"
                            XBindingPath="Month"
                            YBindingPath="Low">
                </chart:StackingAreaSeries>
            </chart:SfCartesianChart.Series>
        </chart:SfCartesianChart>
    </Grid>
</ContentPage>
public class Model
{
public string Month { get; set; }
public double Target { get; set; }
public double High { get; set; }
public double Low { get; set; }
public Model(string xValue, double yValue, double high, double low)
{
Month = xValue;
Target = yValue;
High = high;
Low = low;
}
}
public class ViewModel
{
public ObservableCollection<Model> Data { get; set; }
public ViewModel()
{
Data = new ObservableCollection<Model>()
{
new Model("2010", 100,90,60),
new Model("2011", 120,100,80),
new Model("2012", 140,120,90),
new Model("2013", 160,140,100),
};
}
}Learning resources


.NET MAUI Stacked Area Chart User Guide
Learn available options to customize the .NET MAUI Stacked Area chart.
