

We are glad to announce that our 2019 Volume 3 beta release has rolled out. In this blog, you are going to see a quick overview of the new features and enhancements done in the Essential JS 2 Charts libraries. These features are available on the JavaScript, Angular, React, Vue, ASP.NET MVC, ASP.NET Core, and Blazor platforms.
Let’s look at the new features and enhancements.
Multi-region selection
The Selection feature allows you to fetch a collection of data under a region in a chart. Multiselection enables you to fetch different collections of data from multiple regions of a chart. It also allows you to move a selected region to a different position.
The following code example illustrates how to allow multi-selection in a chart.
import { ChartSelection } from '@syncfusion/ej2-charts';
Chart.Inject(Selection);

let chart: Chart = new Chart({

    selectionMode: 'DragXY',

    // Allows multiple selection on chart.

    allowMultiSelection: true,

}, '#element');
Lasso selection
The Charts control now allows you to select a region by drawing freehand shapes to fetch a collection of data. You can also select multiple regions on a chart through this mode.
The following code example illustrates how to enable this lasso selection.
import { ChartSelection } from '@syncfusion/ej2-charts';
Chart.Inject(Selection);

import { Chart, Selection } from '@syncfusion/ej2-charts';
Chart.Inject(Selection);

let chart: Chart = new Chart({

    selectionMode: 'Lasso',


}, '#element');
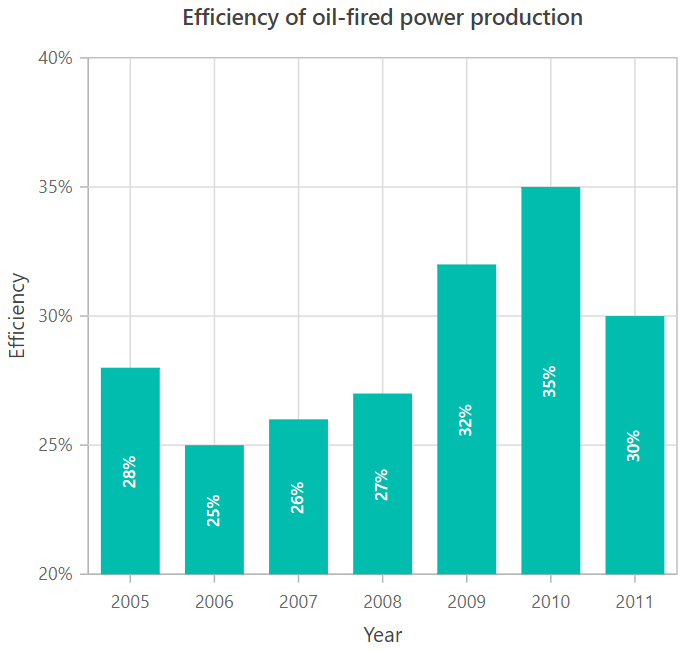
Data label rotation
Support has been added to rotate data labels in charts. You can specify the angle at which the label should rotate.
The following code example illustrates how to rotate the label 90 degrees.
import { Chart, ColumnSeries, DataLabel } from '@syncfusion/ej2-charts';
Chart.Inject(ColumnSeries, DataLabel);

let chart: Chart = new Chart({

    series: [
            {
                type: 'Column',
                marker: {
                    To rotate the datalabel
                    dataLabel: { enableRotation: true, angle: 90,  }
                }
            }
        ],

}, '#element');
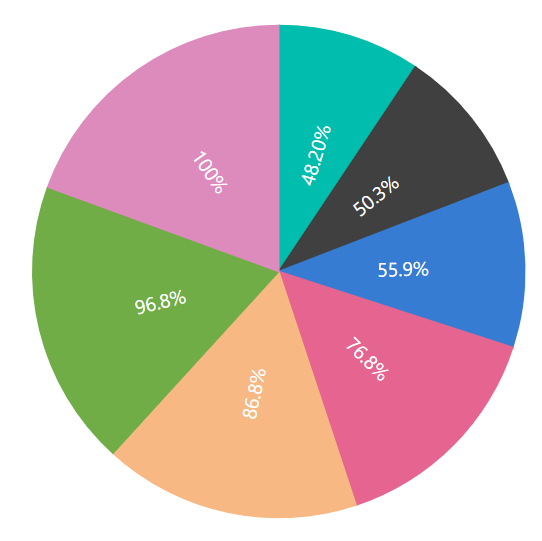
You can also rotate the data labels in pie and doughnut charts. By default, when enableRotation is true, the labels will be rotated along the pie slice. You can change the angle of rotation by using the angle property.
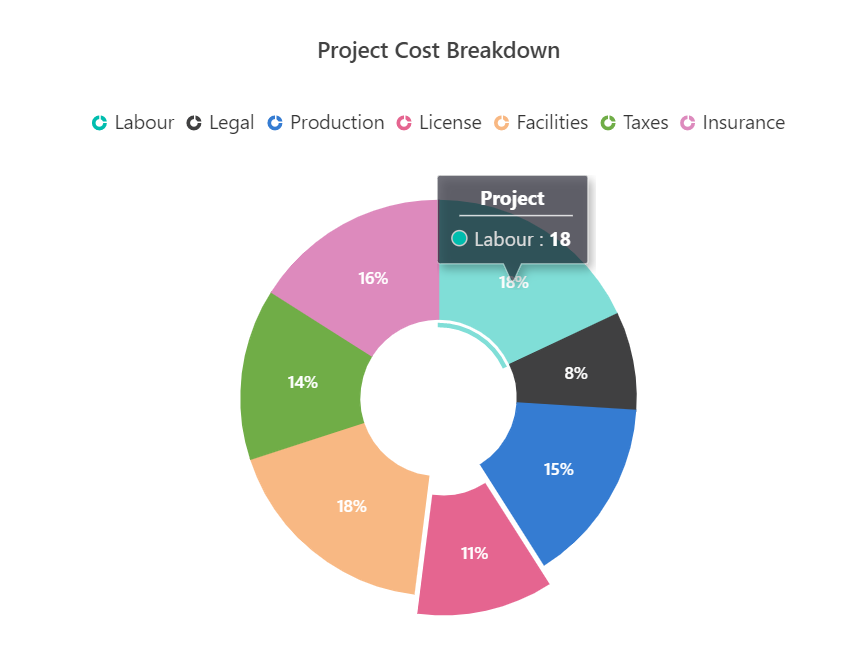
Pie and doughnut highlight
A new feature allows pie and doughnut slices to be highlighted along with the border when the mouse moves over them. The following image shows the highlighted points on interaction.
Conclusion
In addition to these features, we have included some minor improvements and bug fixes. For existing customers, the new version is available for download from the License and Downloads page. If you are not yet a customer, you can try our 30-day free trial to check out these new features. Try our samples from this GitHub location.
If you wish to send us feedback or would like to submit any questions, please feel free to post them in the comments section below, or contact us through our support forum, Direct-Trac, or feedback portal.


 No spam, just valuable updates.