
The Syncfusion Gantt Chart component is the most feature-loaded Gantt Chart in the Blazor market. Yet there was ample space for improving its performance for our 2022 Volume 1 release.
In this blog, we will see how well the performance has been improved in the Blazor Gantt Chart component.
Improvements
To improve the performance of the Gantt Chart component, we tweaked the component lifecycle and revamped the synchronization of the chart and tree grid parts of the Gantt Chart.
We primarily refined the algorithm for data manipulation and operations in our Gantt Chart source code. We handled this carefully, as it contains a complex hierarchical structure, and each piece of data has more dependencies on multiple other pieces of data.
We worked hard on these areas and improved performance to around 20 times better than before with virtualization and around three times better without virtualization.
Let’s look at this in more detail.
Performance optimization on initial loading
The following tables show the performance metrics of the Blazor Gantt Chart component during initial load with 2,500 and 5,000 records, comparing the 2021 Volume 4 and 2022 Volume 1 release versions.
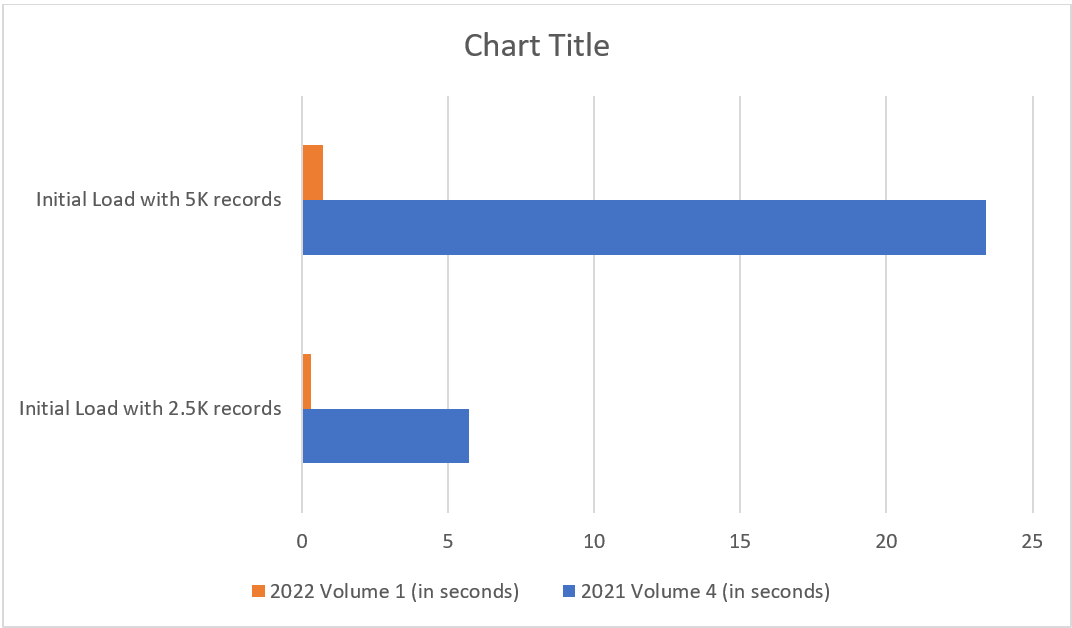
With row virtualization:
| 2021 Volume 4 (in seconds) | 2022 Volume 1 (in seconds) | |
| Initial load with 2.5K records | ~5.7 | ~0.307 |
| Initial load with 5K records | ~23.4 | ~0.724 |
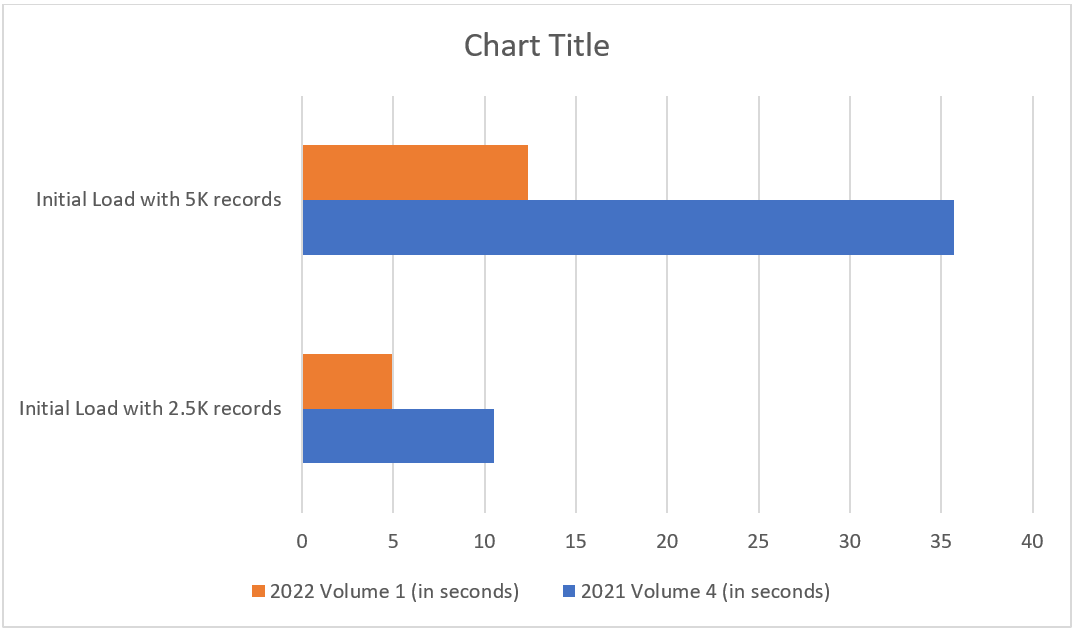
Without row virtualization:
| 2021 Volume 4 (in seconds) | 2022 Volume 1 (in seconds) | |
| Initial load with 2.5K records | ~10.5 | ~4.9 |
| Initial load with 5K records | ~35.7 | ~12.4 |
Note: Metrics were taken in the following machine and application configurations.
Machine: Processor: i5 @ 2.30 GHz, RAM: 8GB, OS: Windows 11
Application: We ran the Blazor server app in the Chrome browser with the component’s script and individual component NuGet Syncfusion.Blazor.Gantt referenced at the app-end.
Performance optimization of interaction features
Not only have we improved the initial loading, but the performance of the features, too. CRUD operations, selection, expand/collapse actions, and more have been improved in our latest release.
The following performance metrics were taken with 5,000 records and with the row virtualization feature enabled.
| For 5,000 records | 2021 Volume 4 (in seconds) | 2022 Volume 1 (in seconds) |
| Expand row | ~0.103 | ~0.082 |
| Collapse row | ~0.132 | ~0.048 |
| Selection | ~1.26 | ~0.011 |
You can still further improve the performance at the app-end by avoiding unnecessary component rerendering.
Note: You can check our Blazor Gantt Chart demos and documentation for detailed explanations and the facts you need to proceed further.
GitHub reference
Also, check out the Syncfusion Blazor Gantt Chart performance metrics GitHub demo.
Conclusion
Thanks for reading! Right now, the Gantt Chart component can handle a maximum of 60 thousand records in the Blazor Server application. We won’t stop here in improving the Gantt Chart’s performance. We will give our best effort to further enhance its performance in the near future. Give it a try now and leave your feedback in the comments section below!
If you would like to try Syncfusion components, you can download our free trial.
If you have questions, you can also contact us through our support forums, support portal, or feedback portal. We are always happy to assist you!


 No spam, just valuable updates.