
ESSENTIAL STUDIO® 2026 VOLUME 1
Blazor
Build Next-Gen Web Applications
- New Chart Wizard component simplifies chart creation.
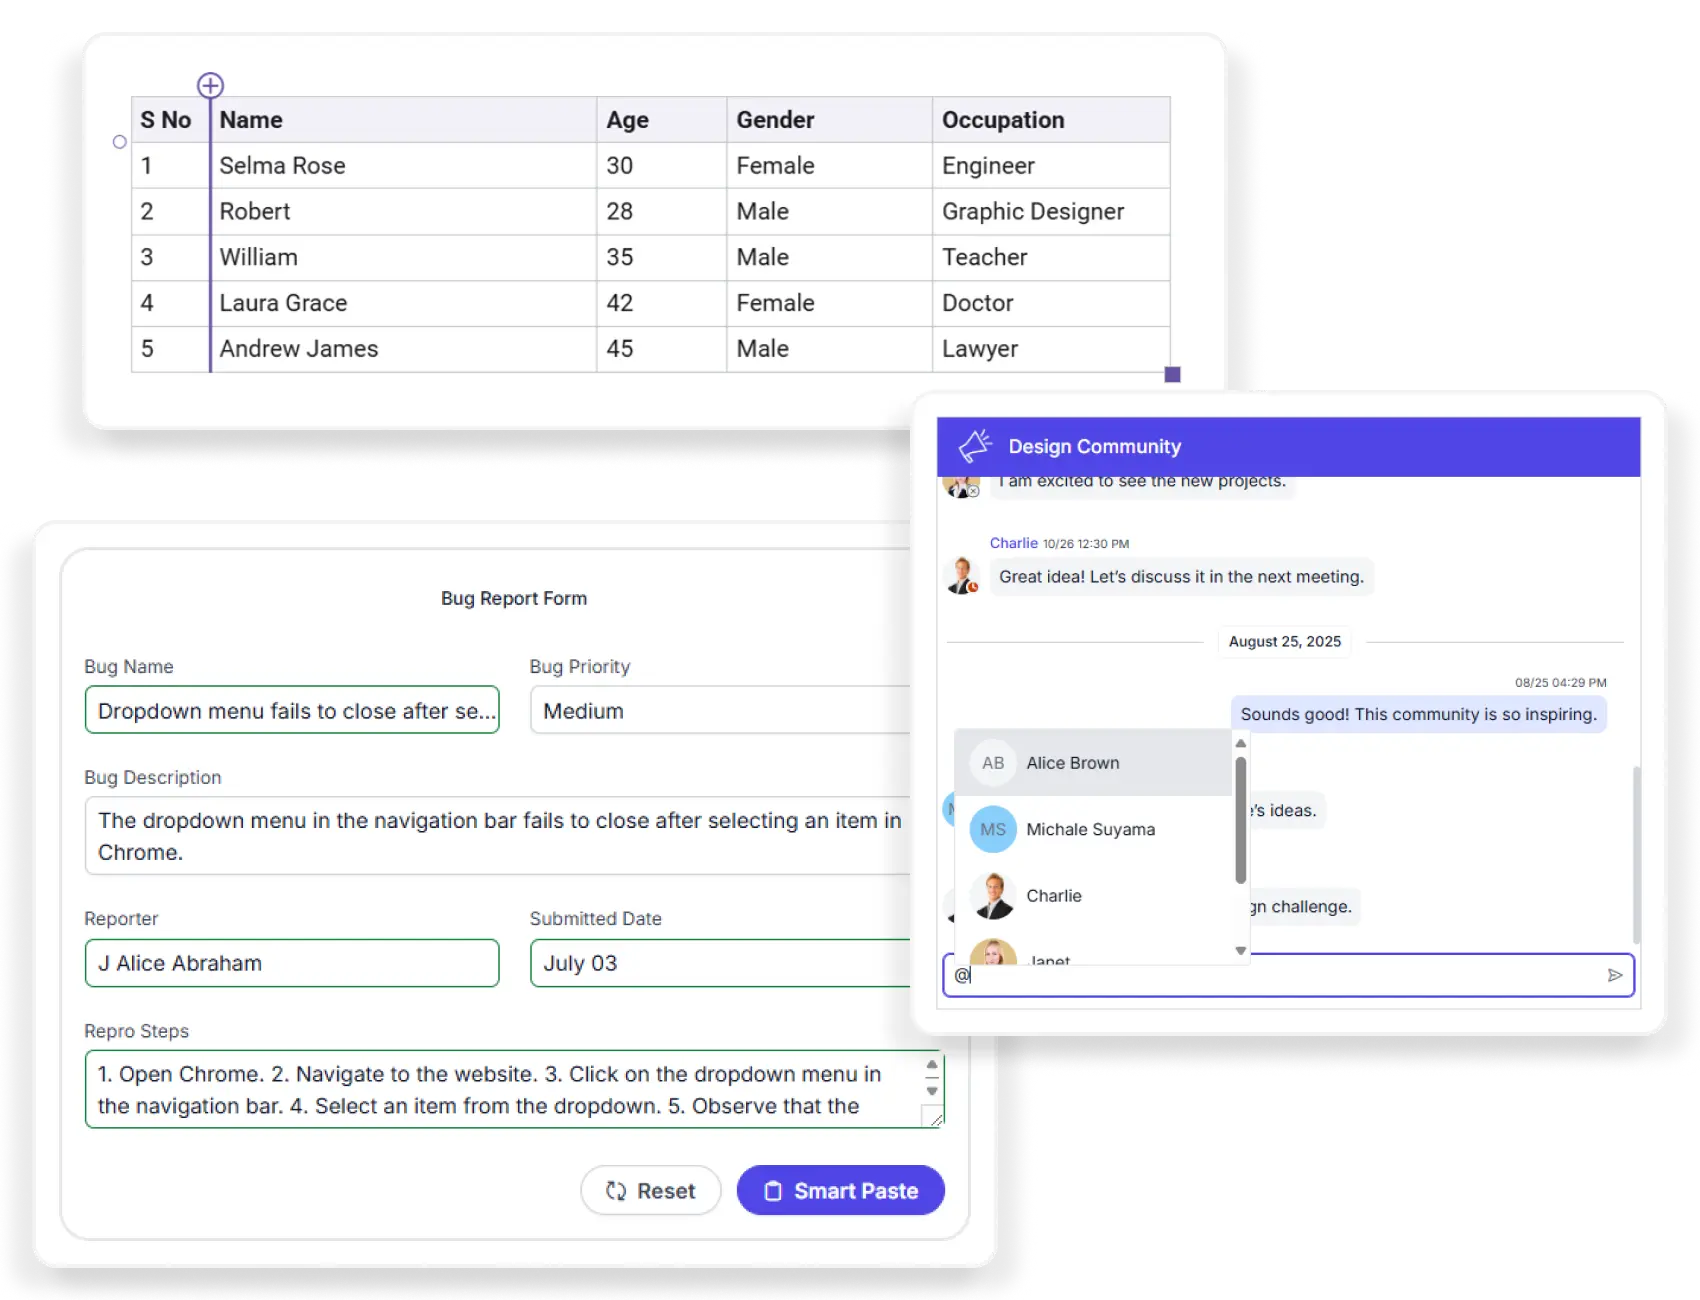
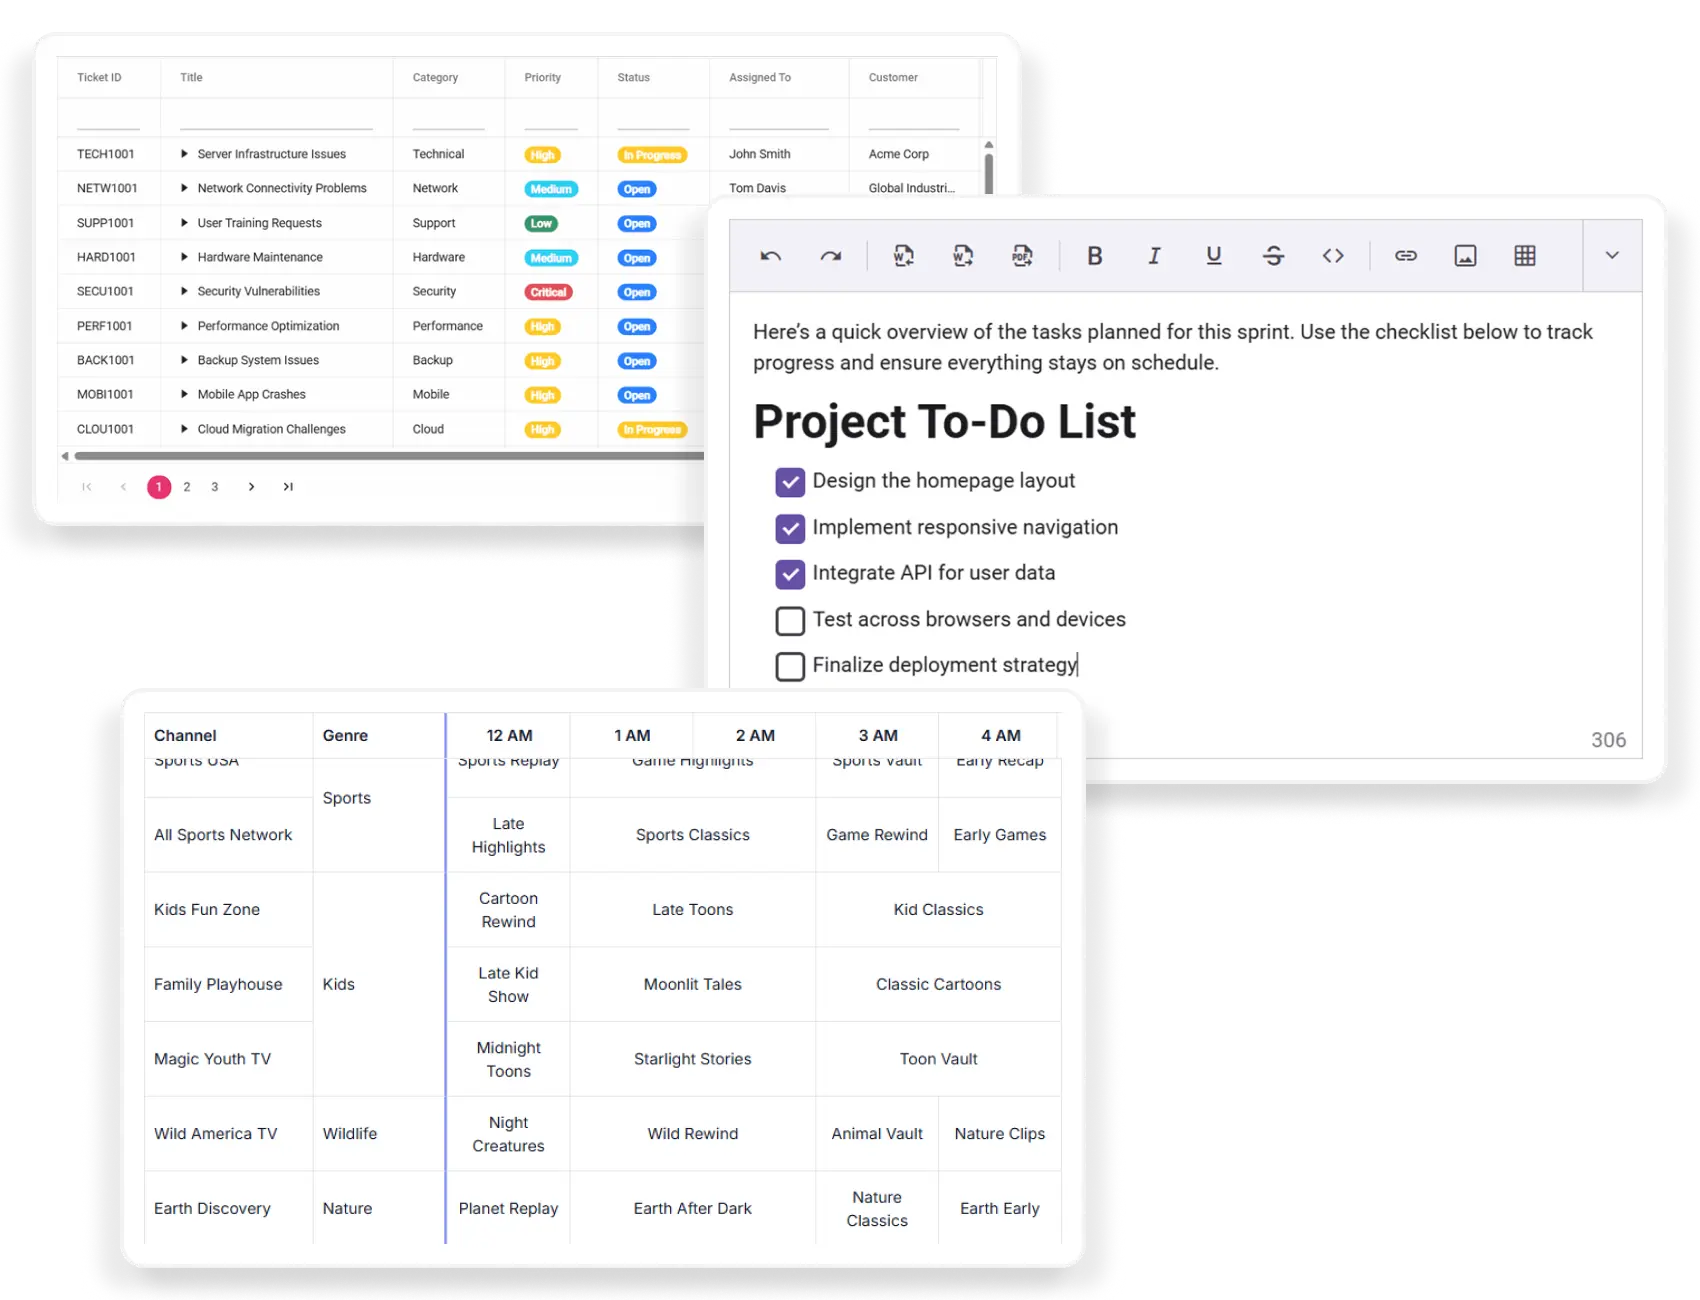
- AI-powered Smart Rich Text Editor with contextual assistance.
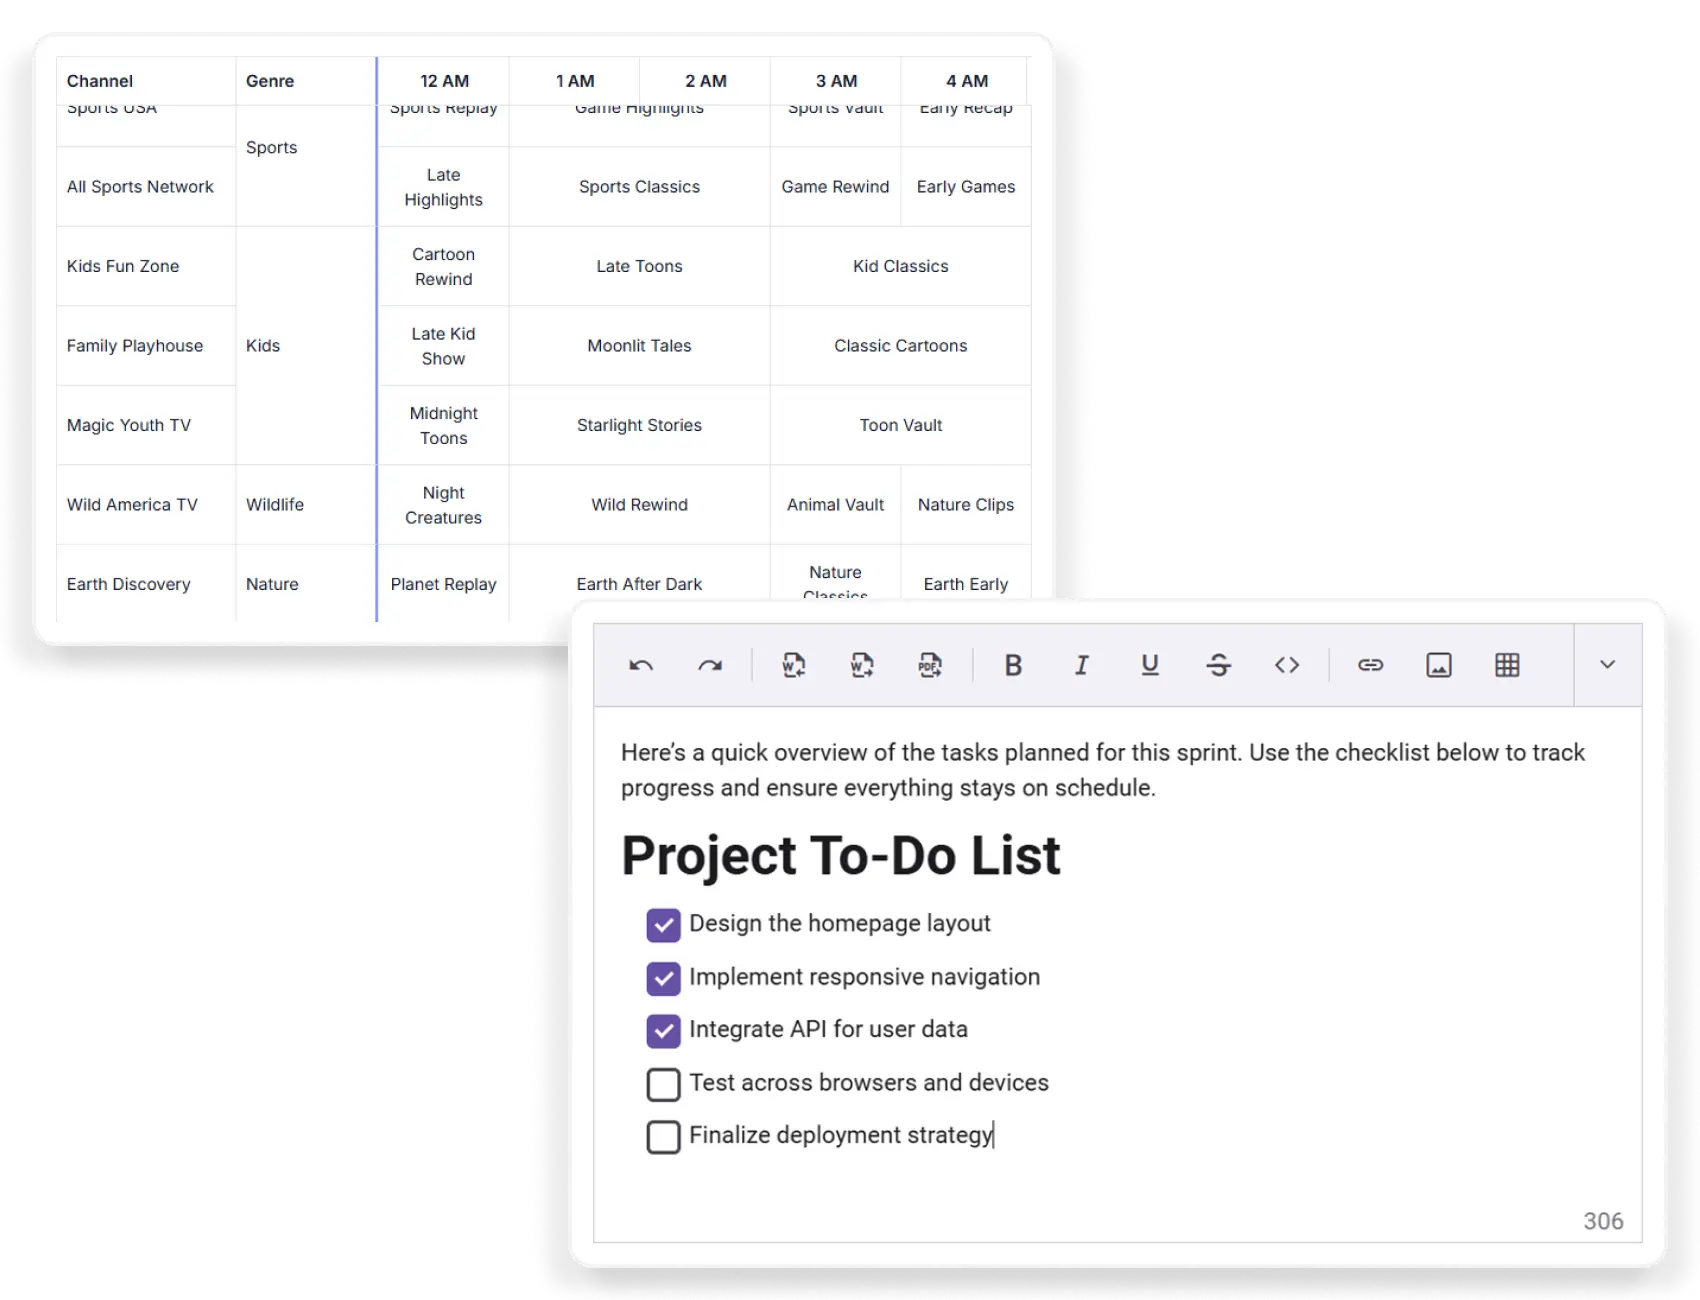
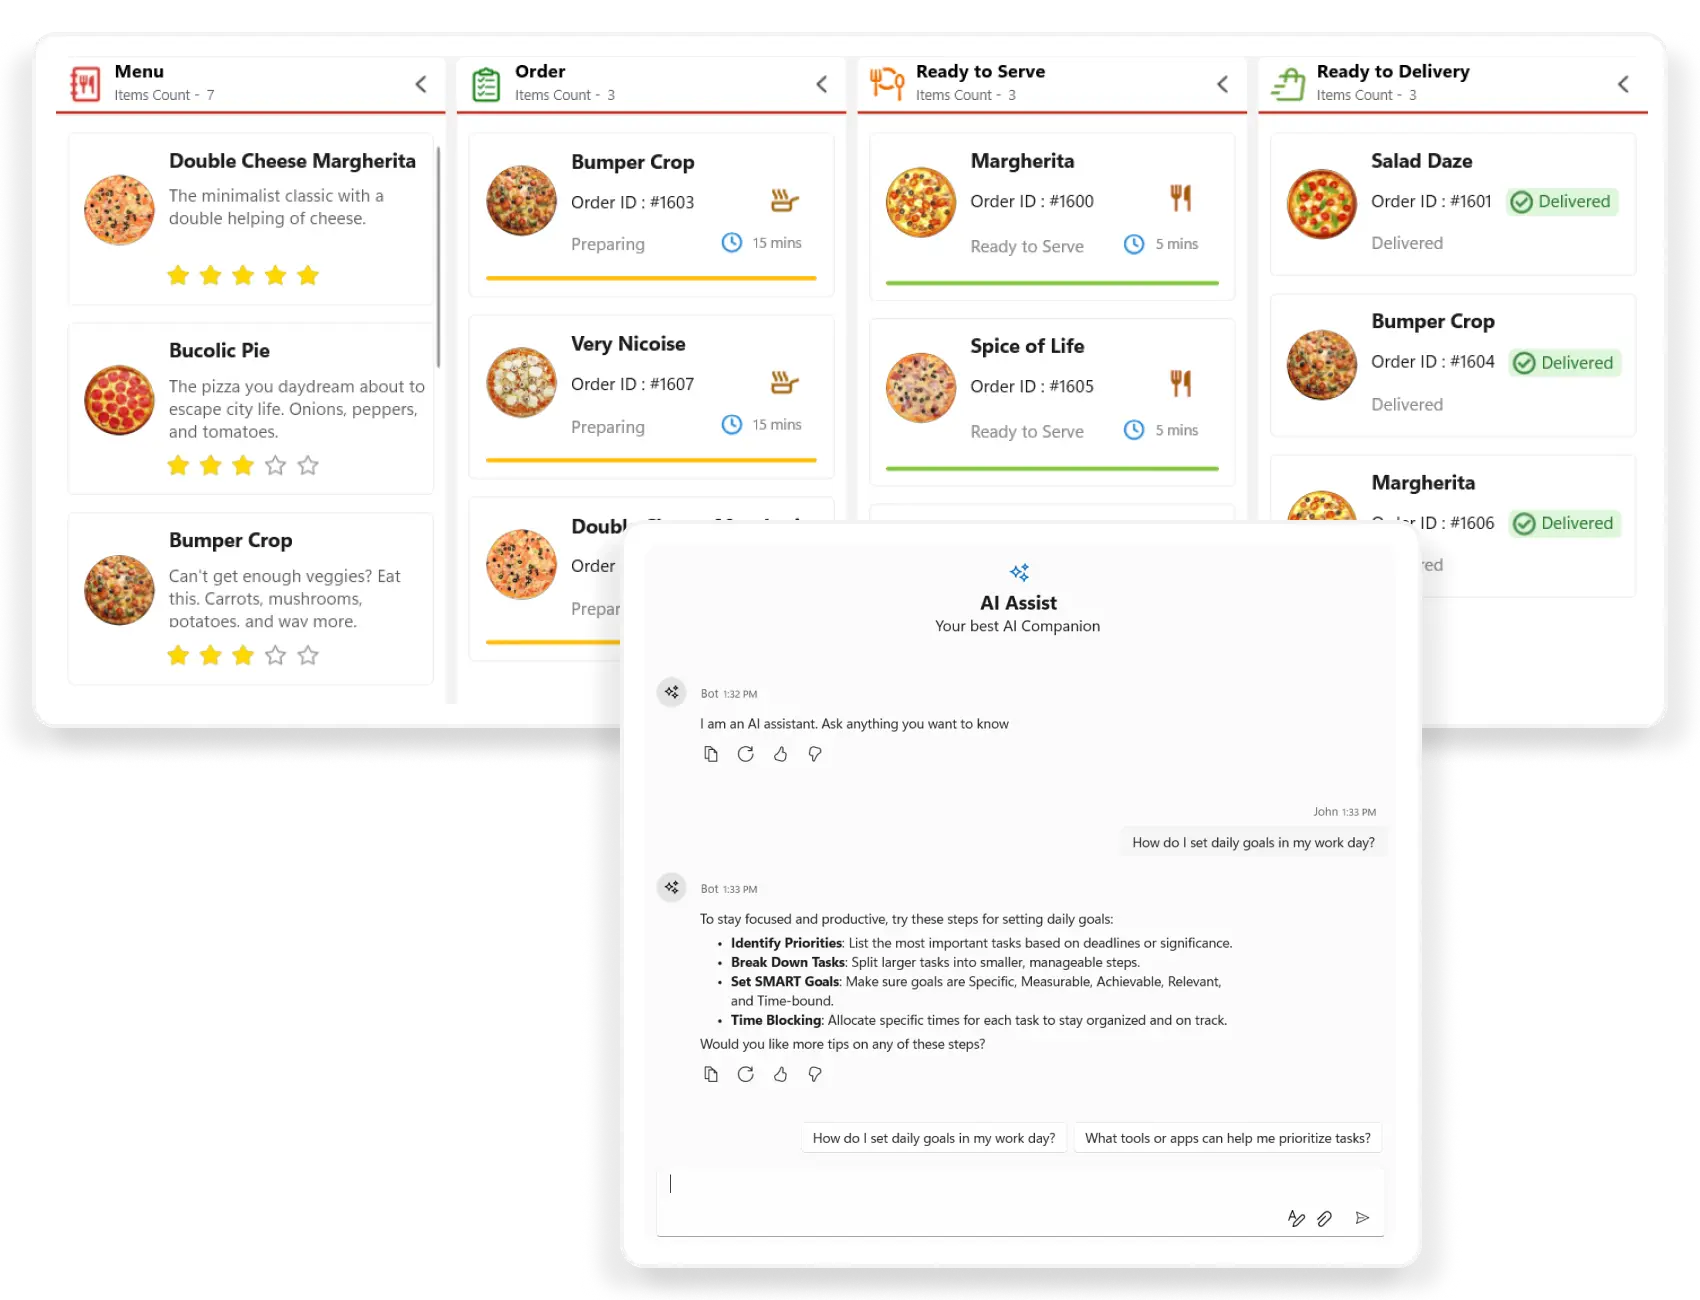
- Streaming AI responses with Markdown rendering in AI AssistView.
Angular
Harness Angular for Impressive Web Apps
- New Inline AI Assist and Sankey Diagram components.
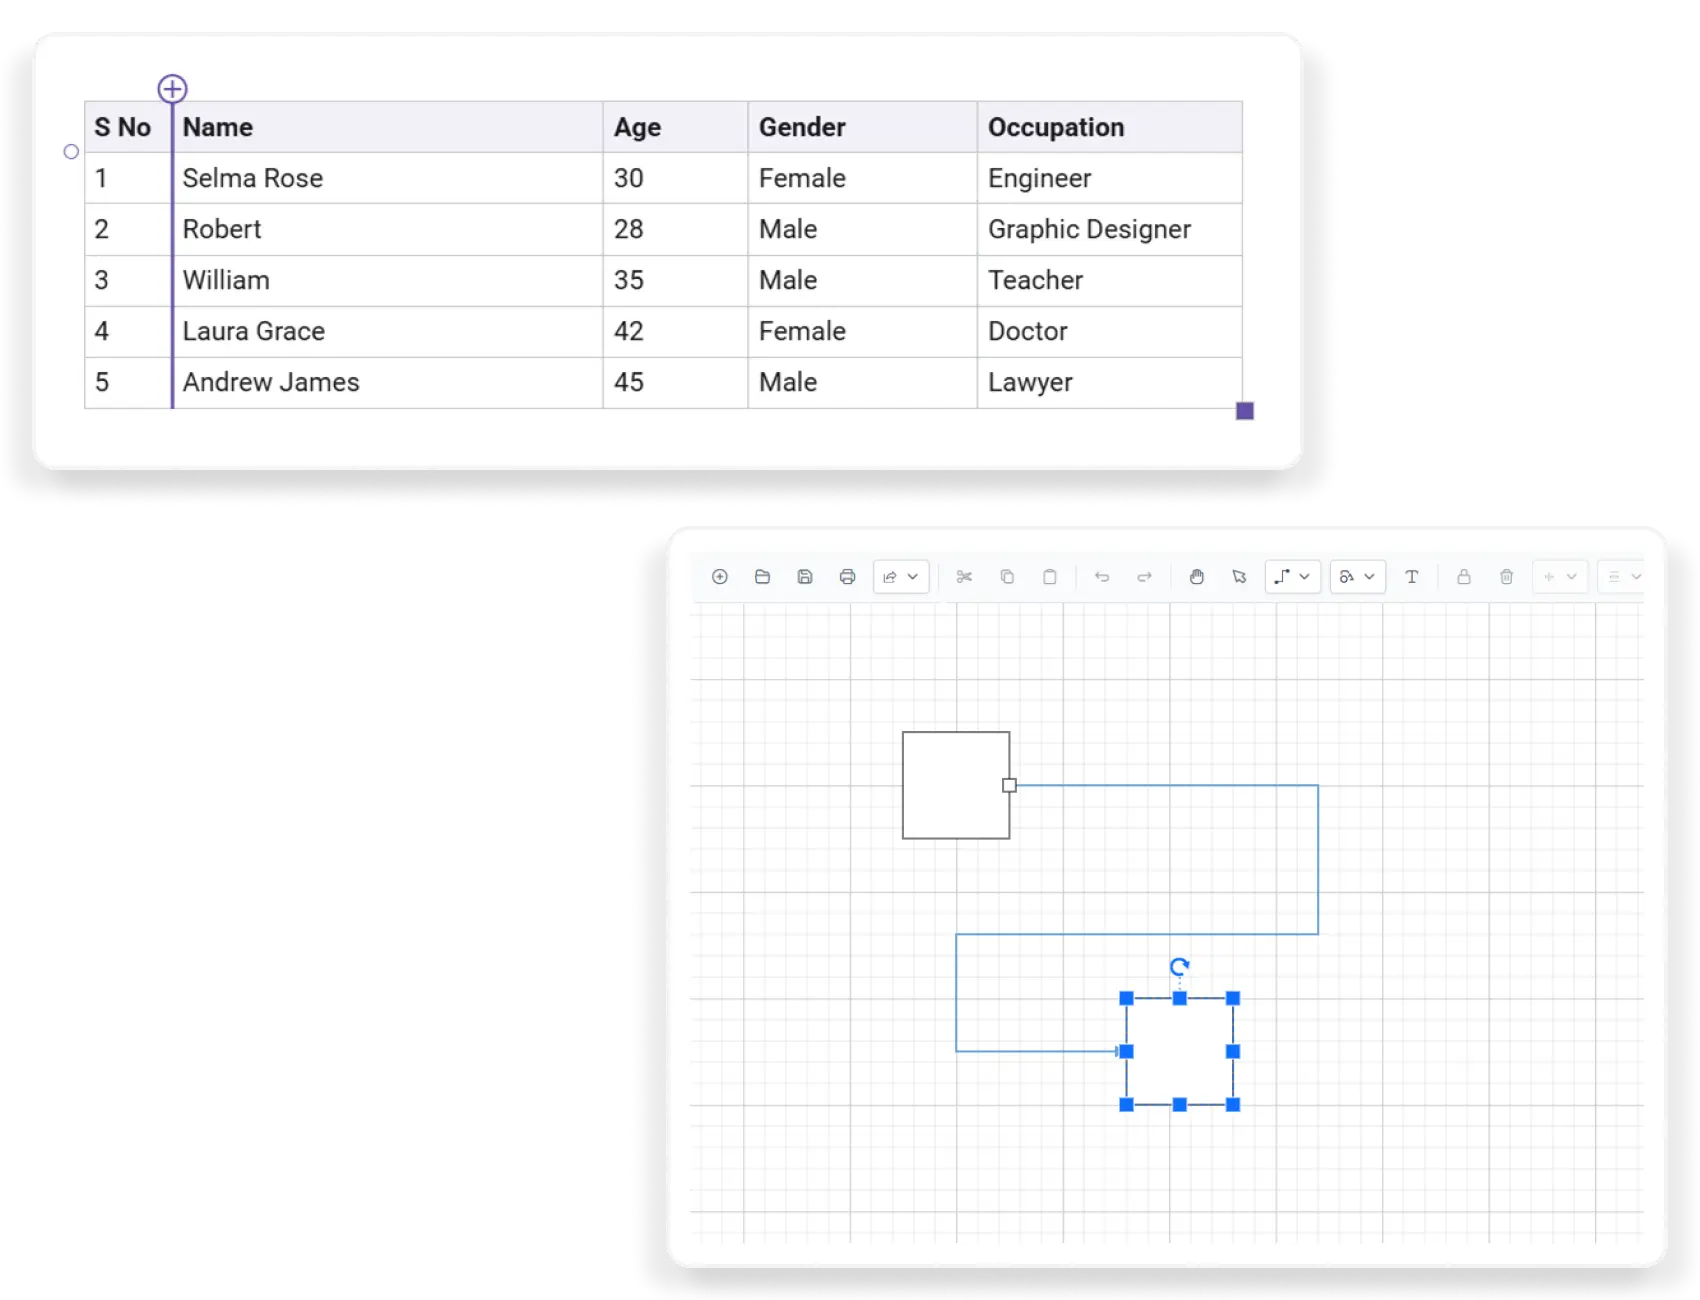
- Real-time collaboration and Visio (.vsdx) file support for Diagram.
- AI AssistView supports speech input and Markdown streaming.
React
Access a Complete Line of React Controls
- New Inline AI Assist and Sankey Diagram components.
- Real-time collaboration and Visio (.vsdx) file support for Diagram.
- Column resizing and improved image uploads in Block Editor.
JavaScript
Get the Most out of JavaScript
- New Inline AI Assist and Sankey Diagram components.
- Column resizing and improved image uploads in Block Editor.
- AI AssistView supports speech input and Markdown streaming.
Vue

Create High-Performance Vue Apps
- New Inline AI Assist and Sankey Diagram components.
- Column resizing and improved image uploads in Block Editor.
- Charts support series labels, legend templates, and gradients.
ASP.NET Core
Publish Superior Web Applications
- New Inline AI Assist component adds contextual AI help within editors.
- New Sankey Diagram component visualizes processes, distributions, and relationships.
- Diagram supports Visio (.vsdx) file importing and exporting.
ASP.NET MVC
Build Powerful Web Apps
- New Inline AI Assist component adds contextual AI help within editors.
- New Sankey Diagram component visualizes processes, distributions, and relationships.
- AI AssistView supports speech-to-text input.
MOBILE
.NET MAUI
Build Cross-Platform Apps
- Cell merging with export support for DataGrid.
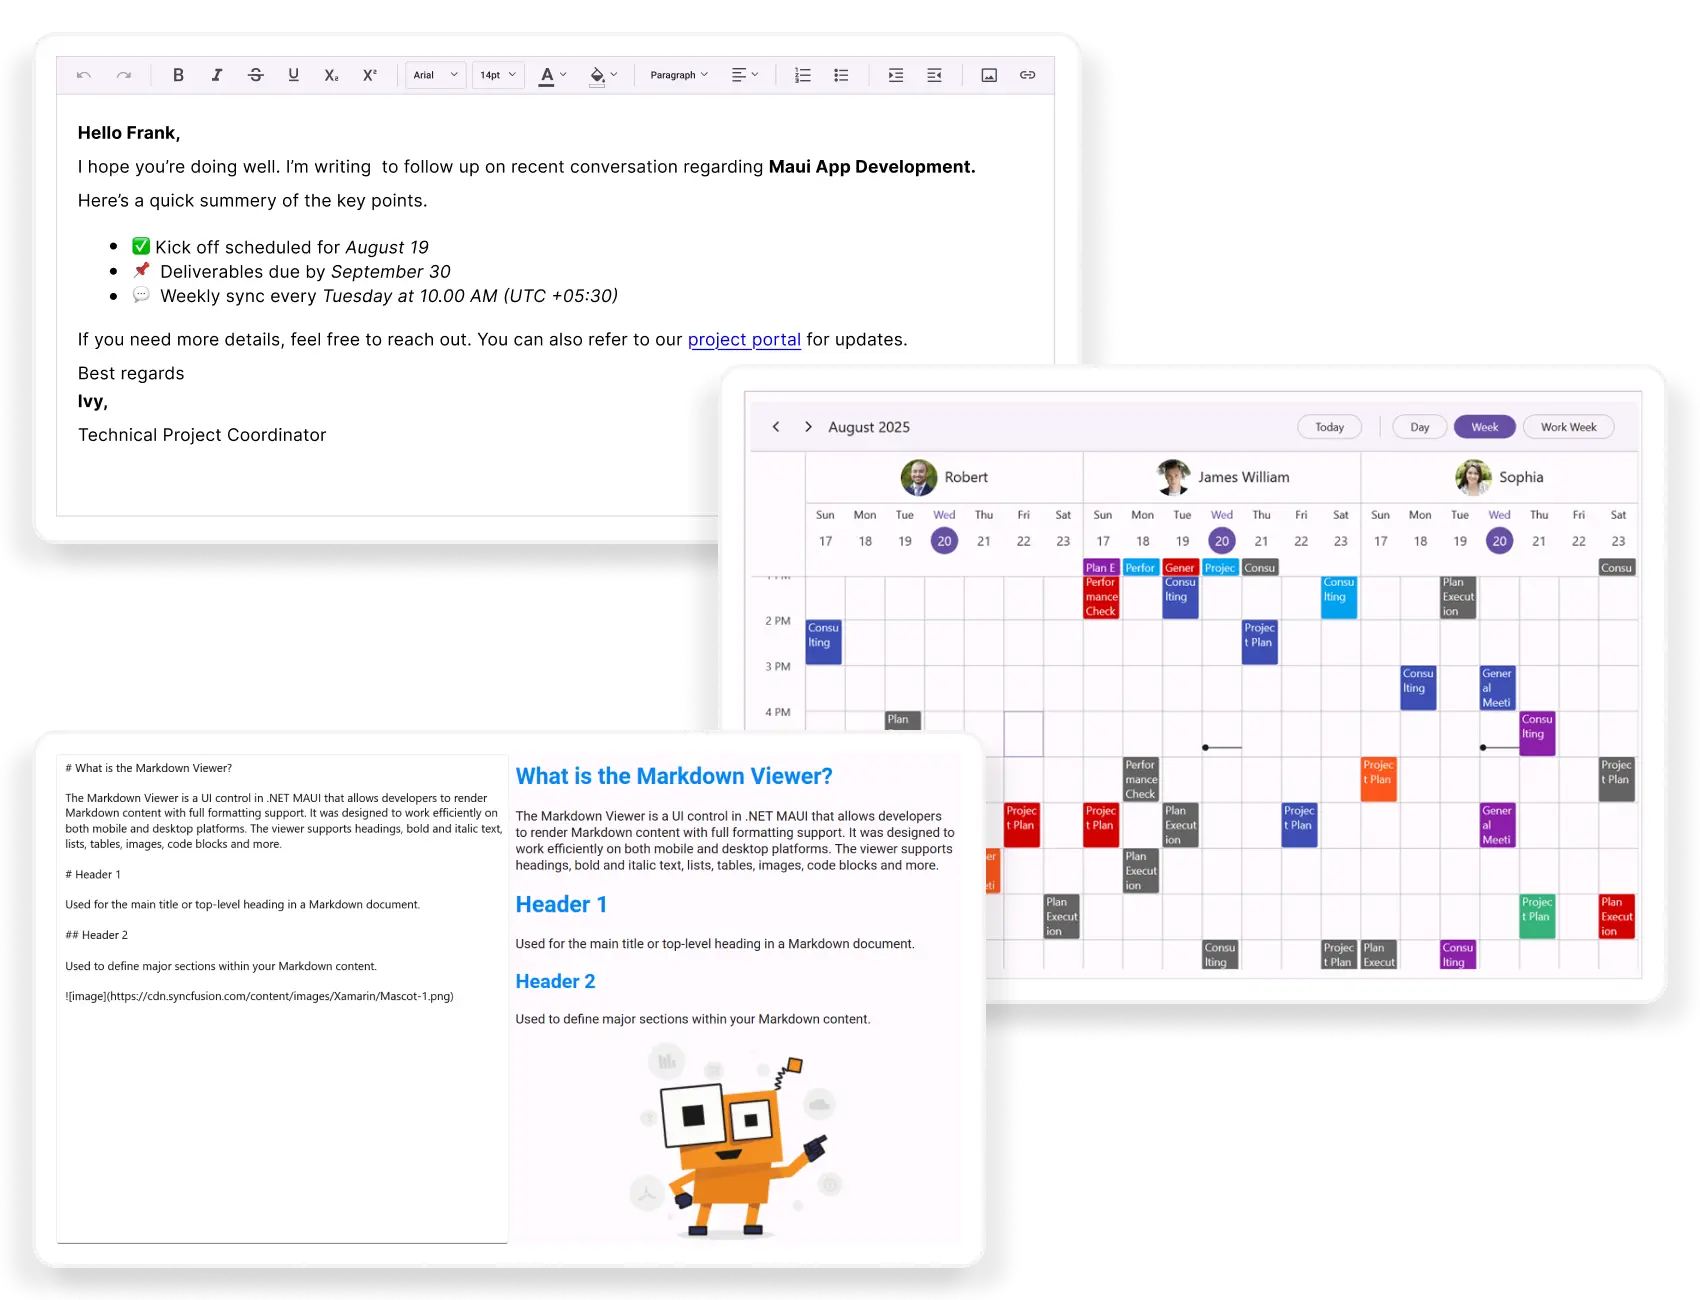
- Built-in appointment editor for Scheduler.
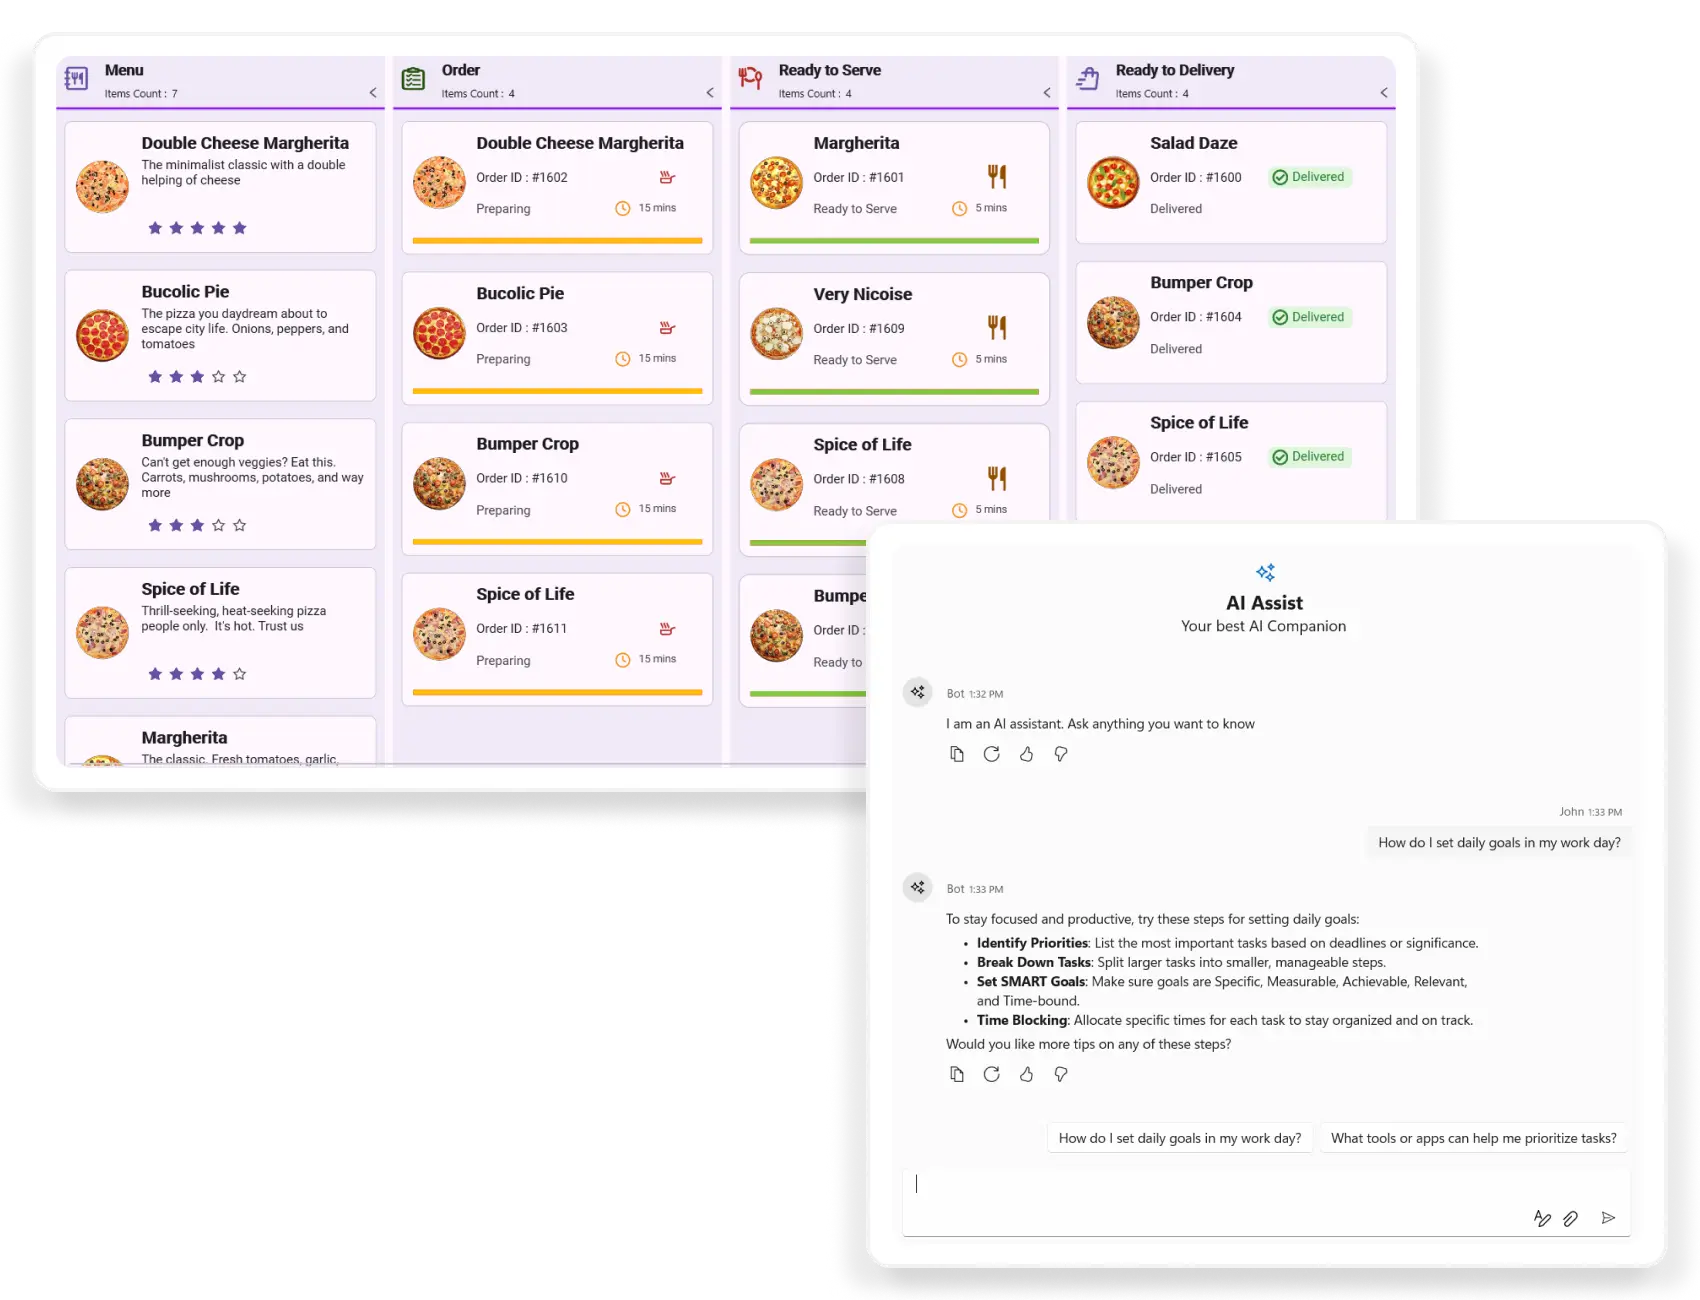
- Chat history, suggestions, and private mode added to AI AssistView.
DESKTOP
WPF
Take Control of the Desktop
- New Markdown Viewer, Tabbed Window, and Toast components.
- New AI-powered Smart Text Editor and Smart DataGrid components.
- Azure Maps integration for Map control.
WinForms
Create Better Apps
- AI AssistView control for AI-powered conversational UI.
- Force-directed tree layout for Diagram.
- Optimized formula engine for faster calculations with the Calculation Engine.
WinUI
Develop Windows apps with advanced technology
- Candlestick charts for quick market sentiment analysis.
- OHLC charts for compact, precise price comparisons.
- NumberBox now supports various numeric data types.
DOCUMENT SOLUTIONS
Document SDK
All-in-One SDKs for Document Processing
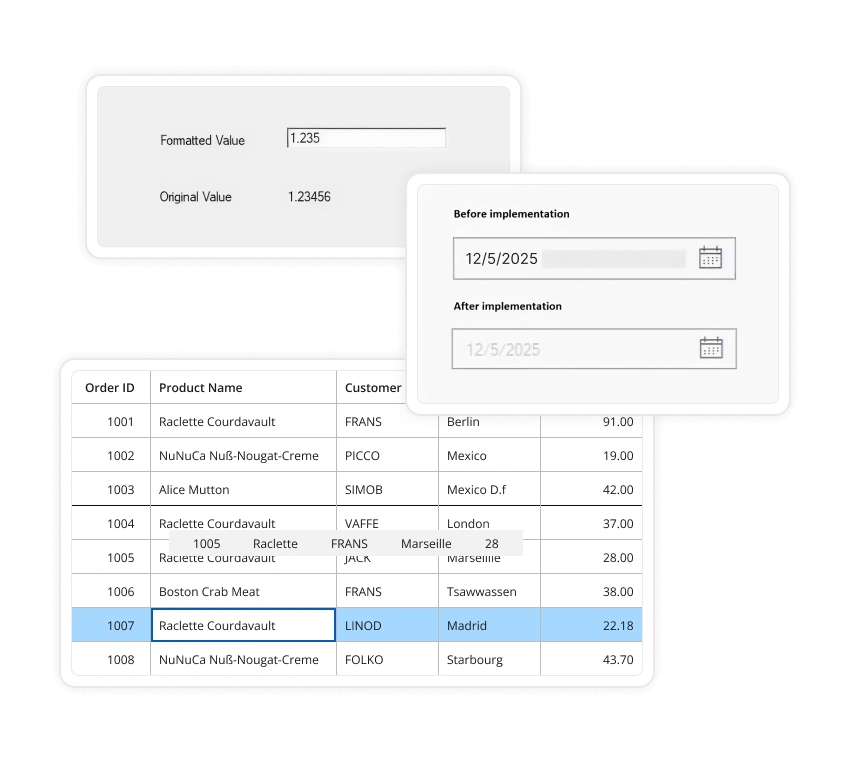
- New Smart Data Extractor library for extracting structures from PDF documents and images.
- New Smart Form Field Recognizer library automatically detects PDF form fields and returns structured JSON.
- Unified font manager improves memory efficiency in PDF conversions.
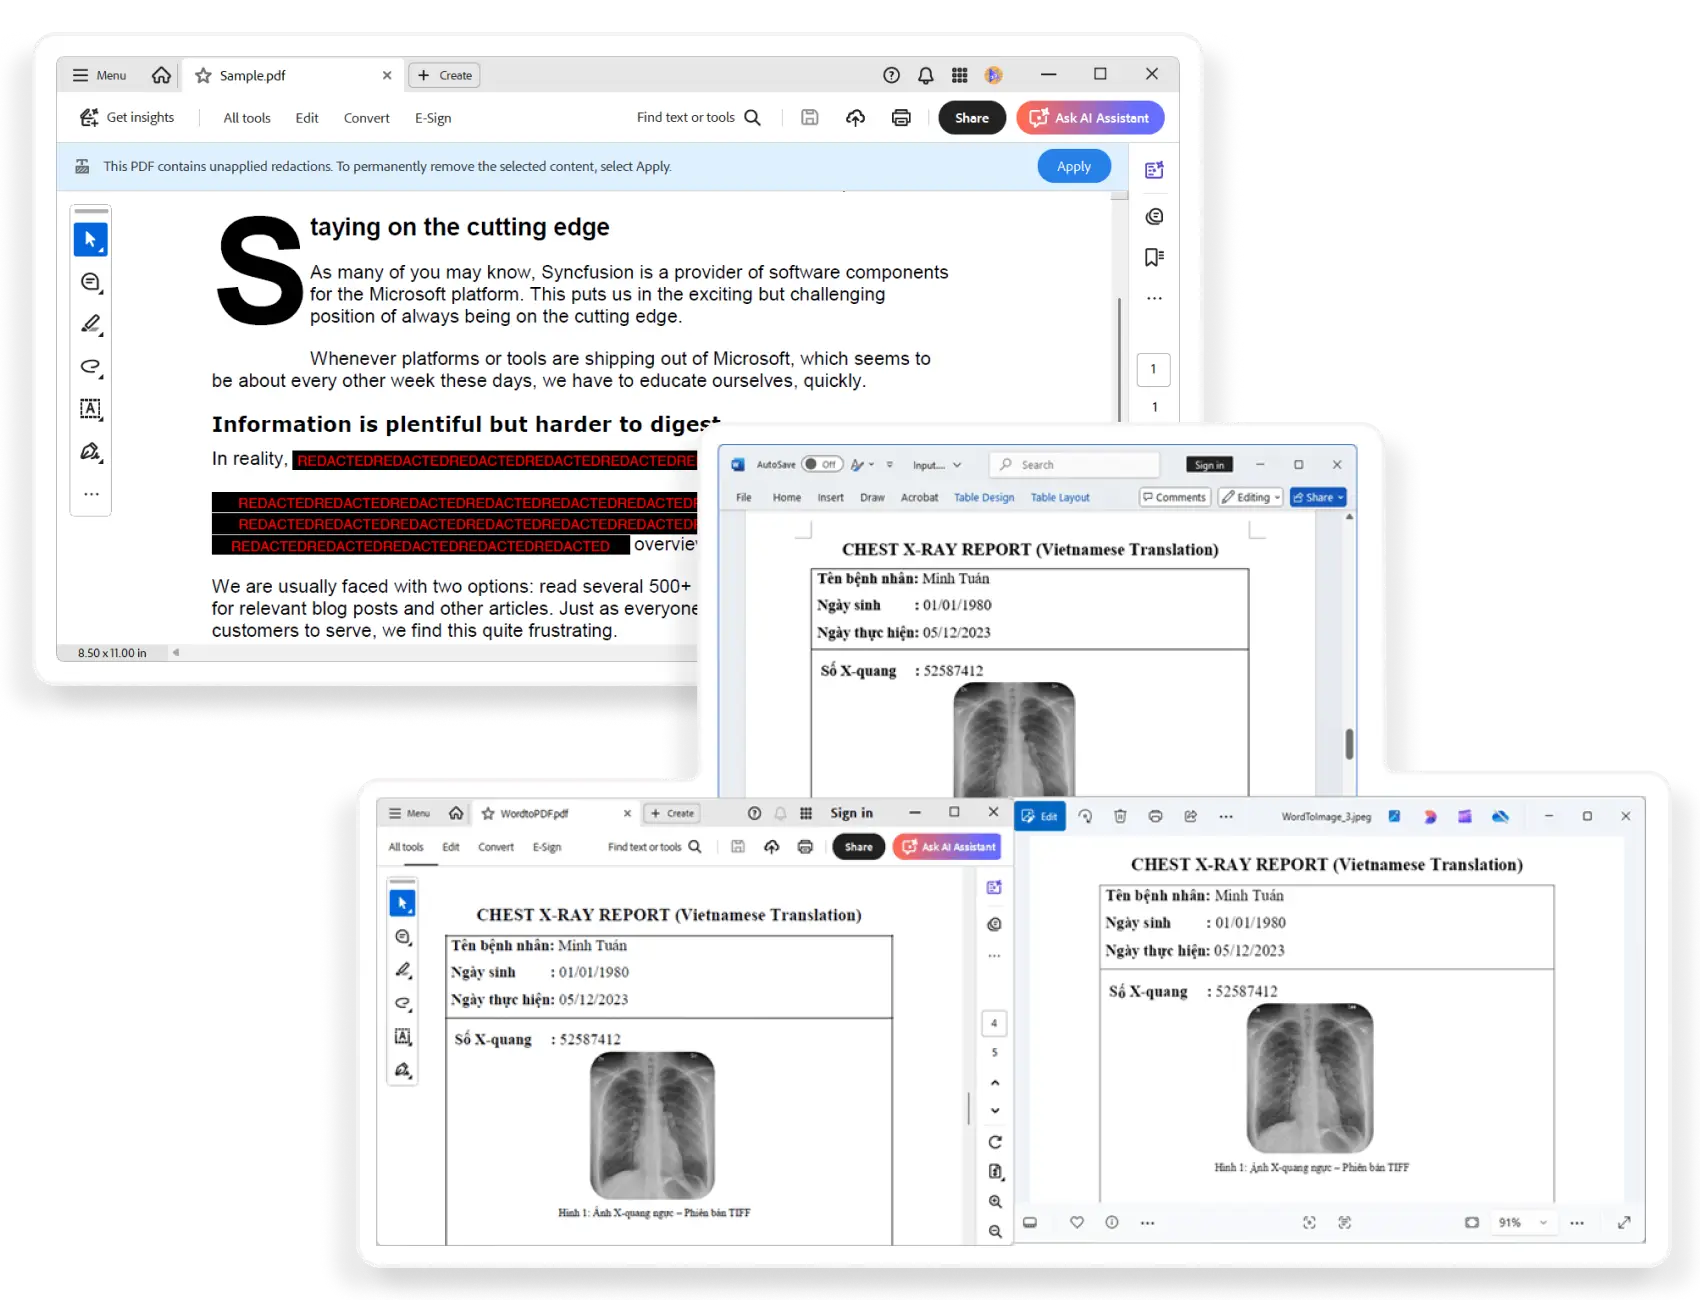
PDF Viewer SDK
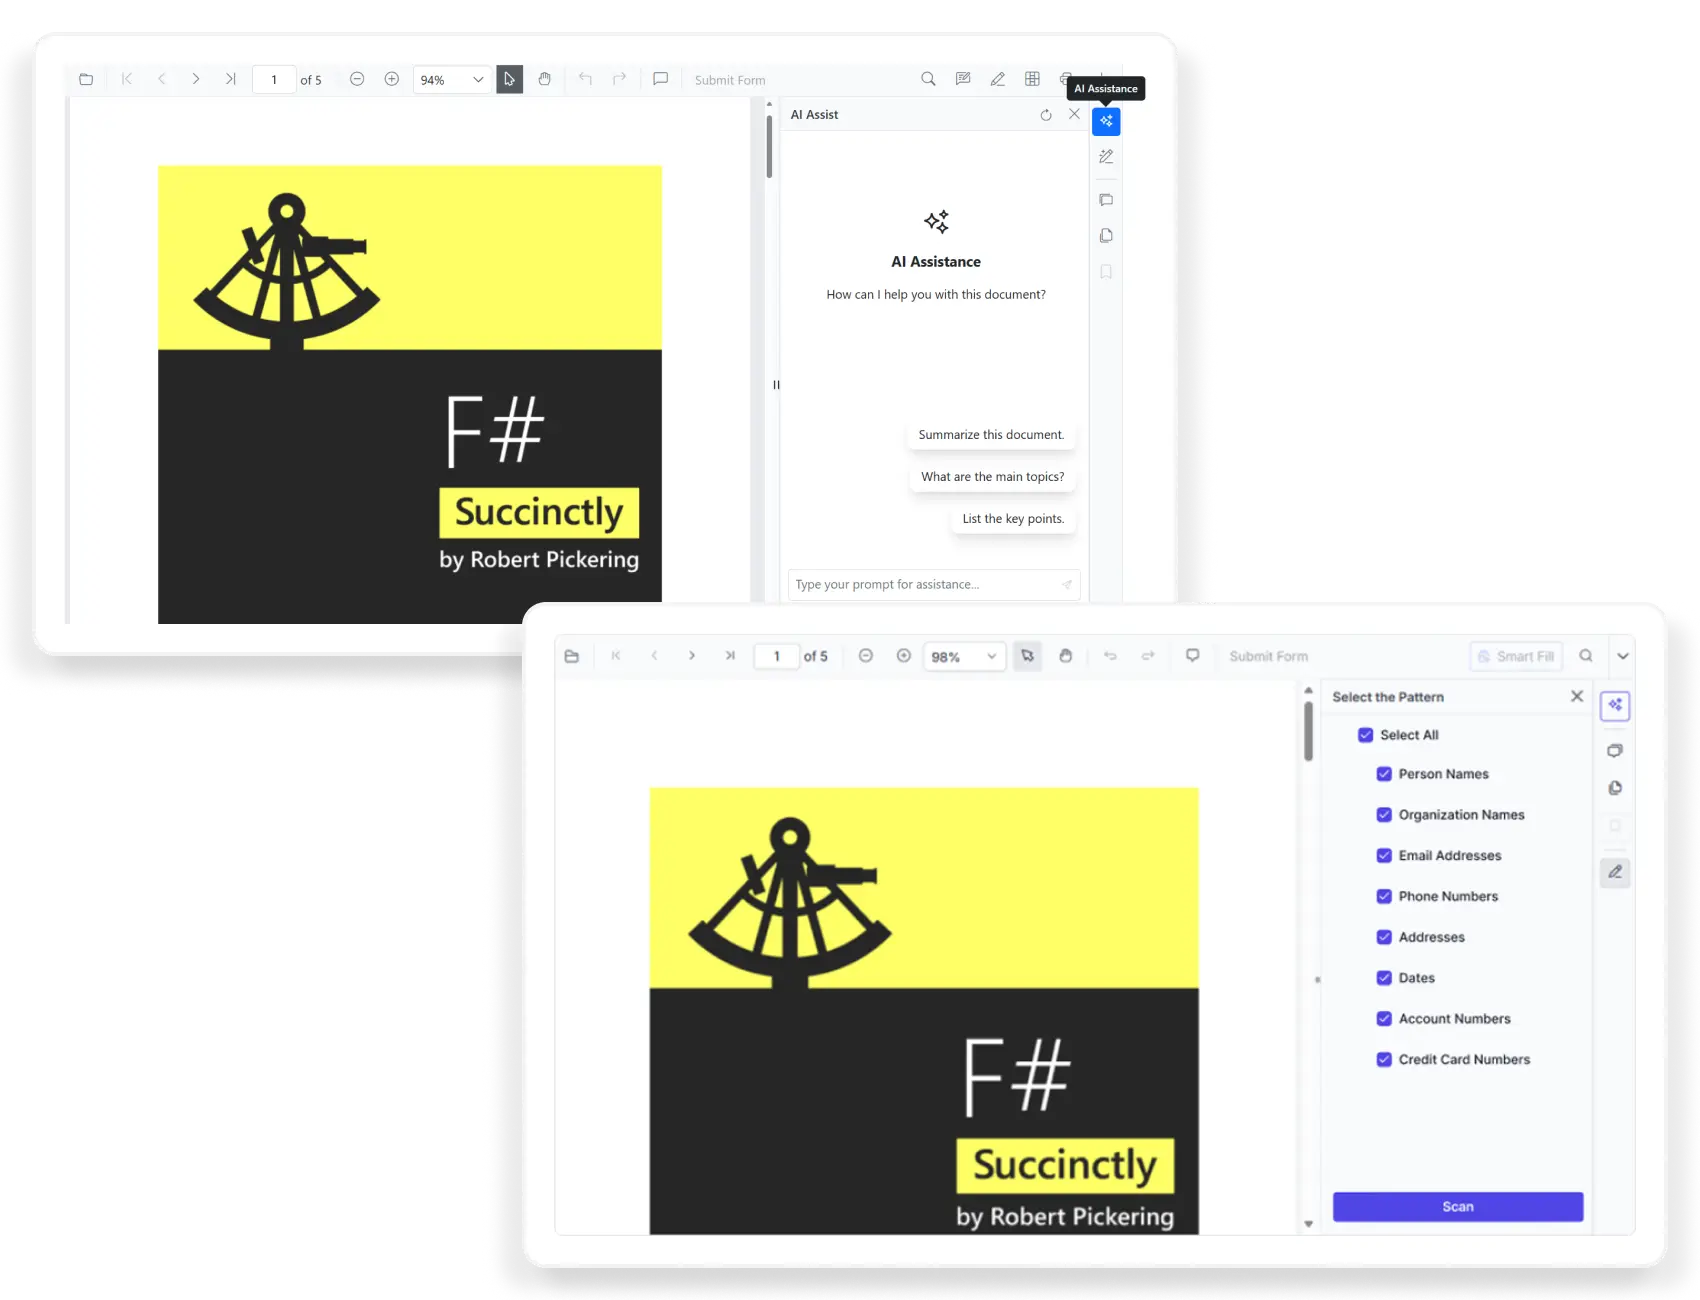
Seamless PDF Viewing & Form Filling
- Blazor Smart PDF Viewer is production-ready.
- Major performance improvements for organizing and searching large PDFs.
- Retrieve and dynamically modify custom stamp annotation views in .NET MAUI.
DOCX Editor SDK
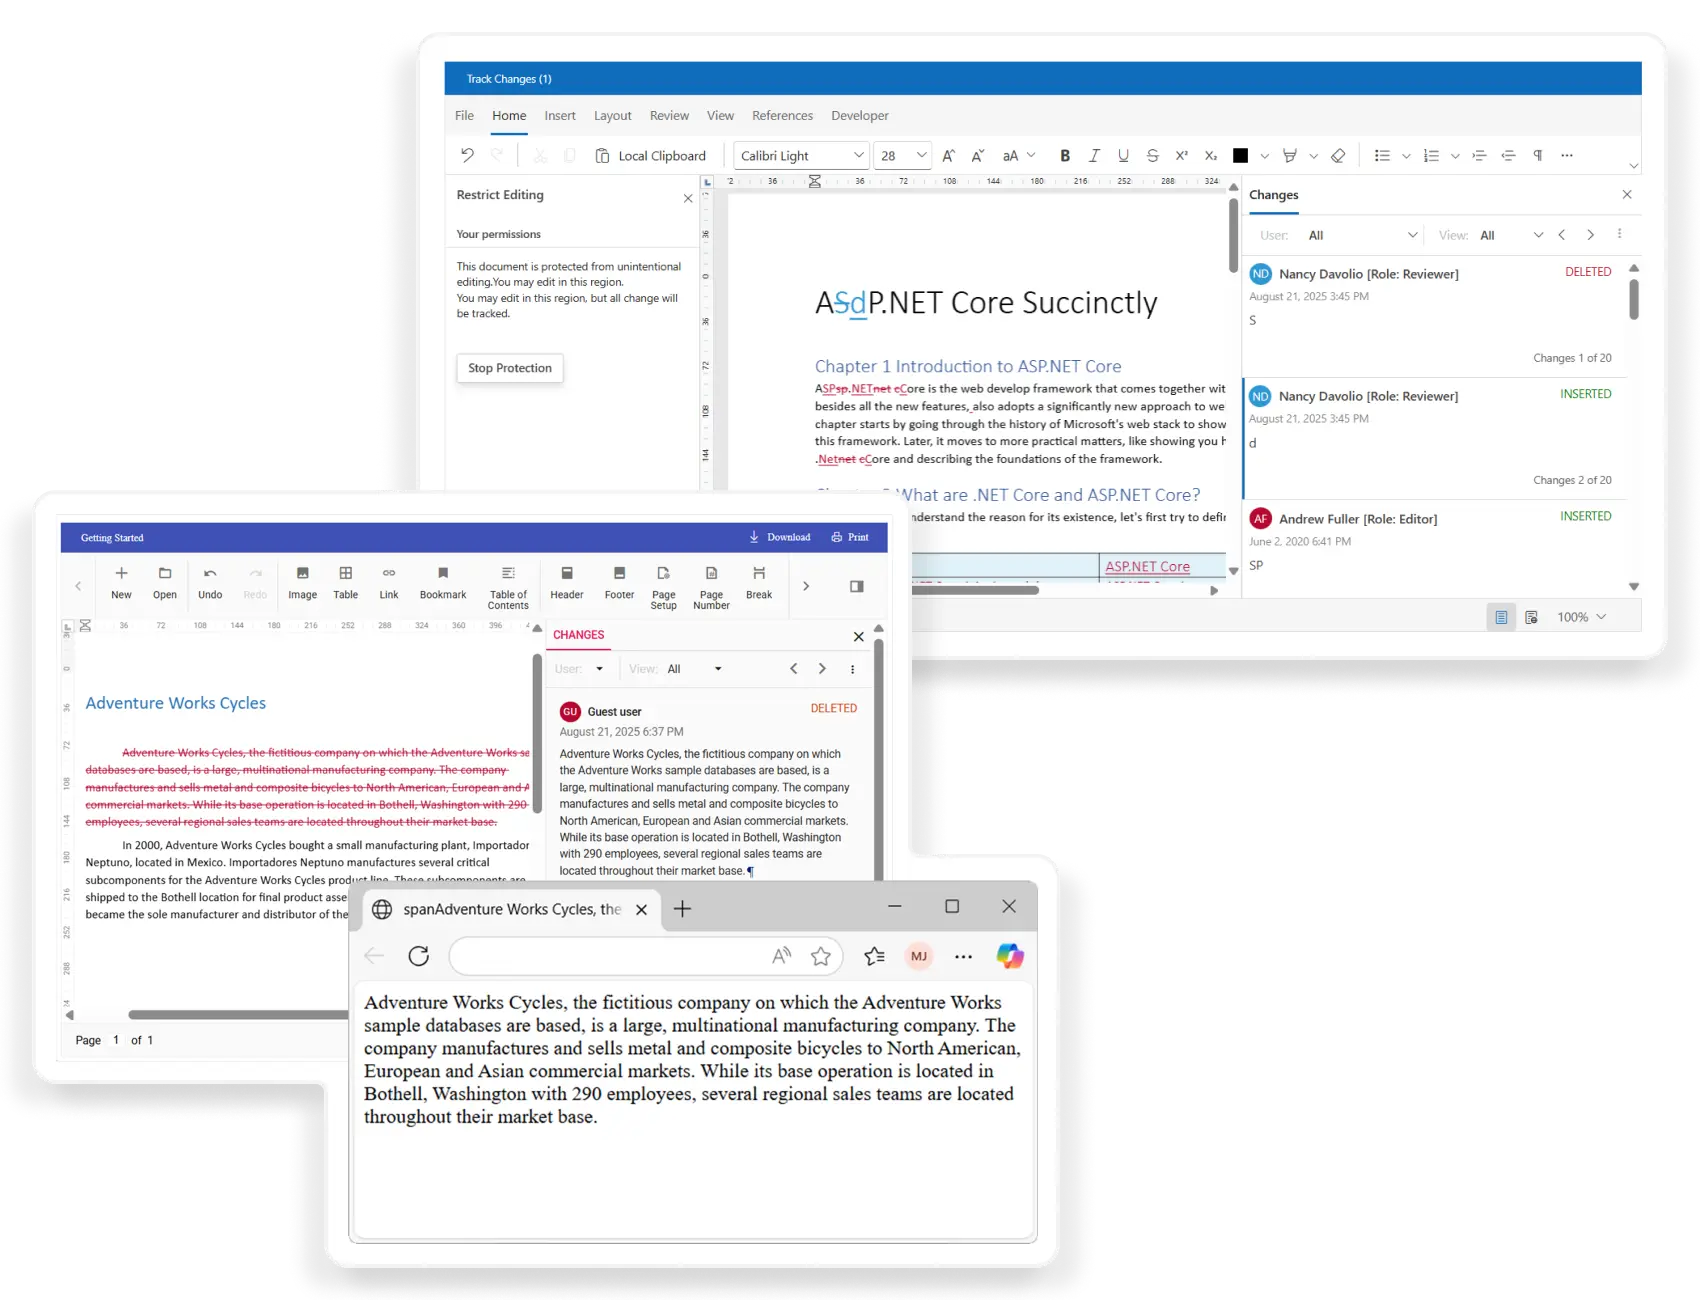
Edit DOCX Documents in the Browser
- Preserves dashed and dotted borders for accurate Word document rendering.
- Improved RTL support for Arabic text editing and tables.
- VS Code extension with ready-to-use Blazor DOCX Editor templates.
Spreadsheet Editor SDK
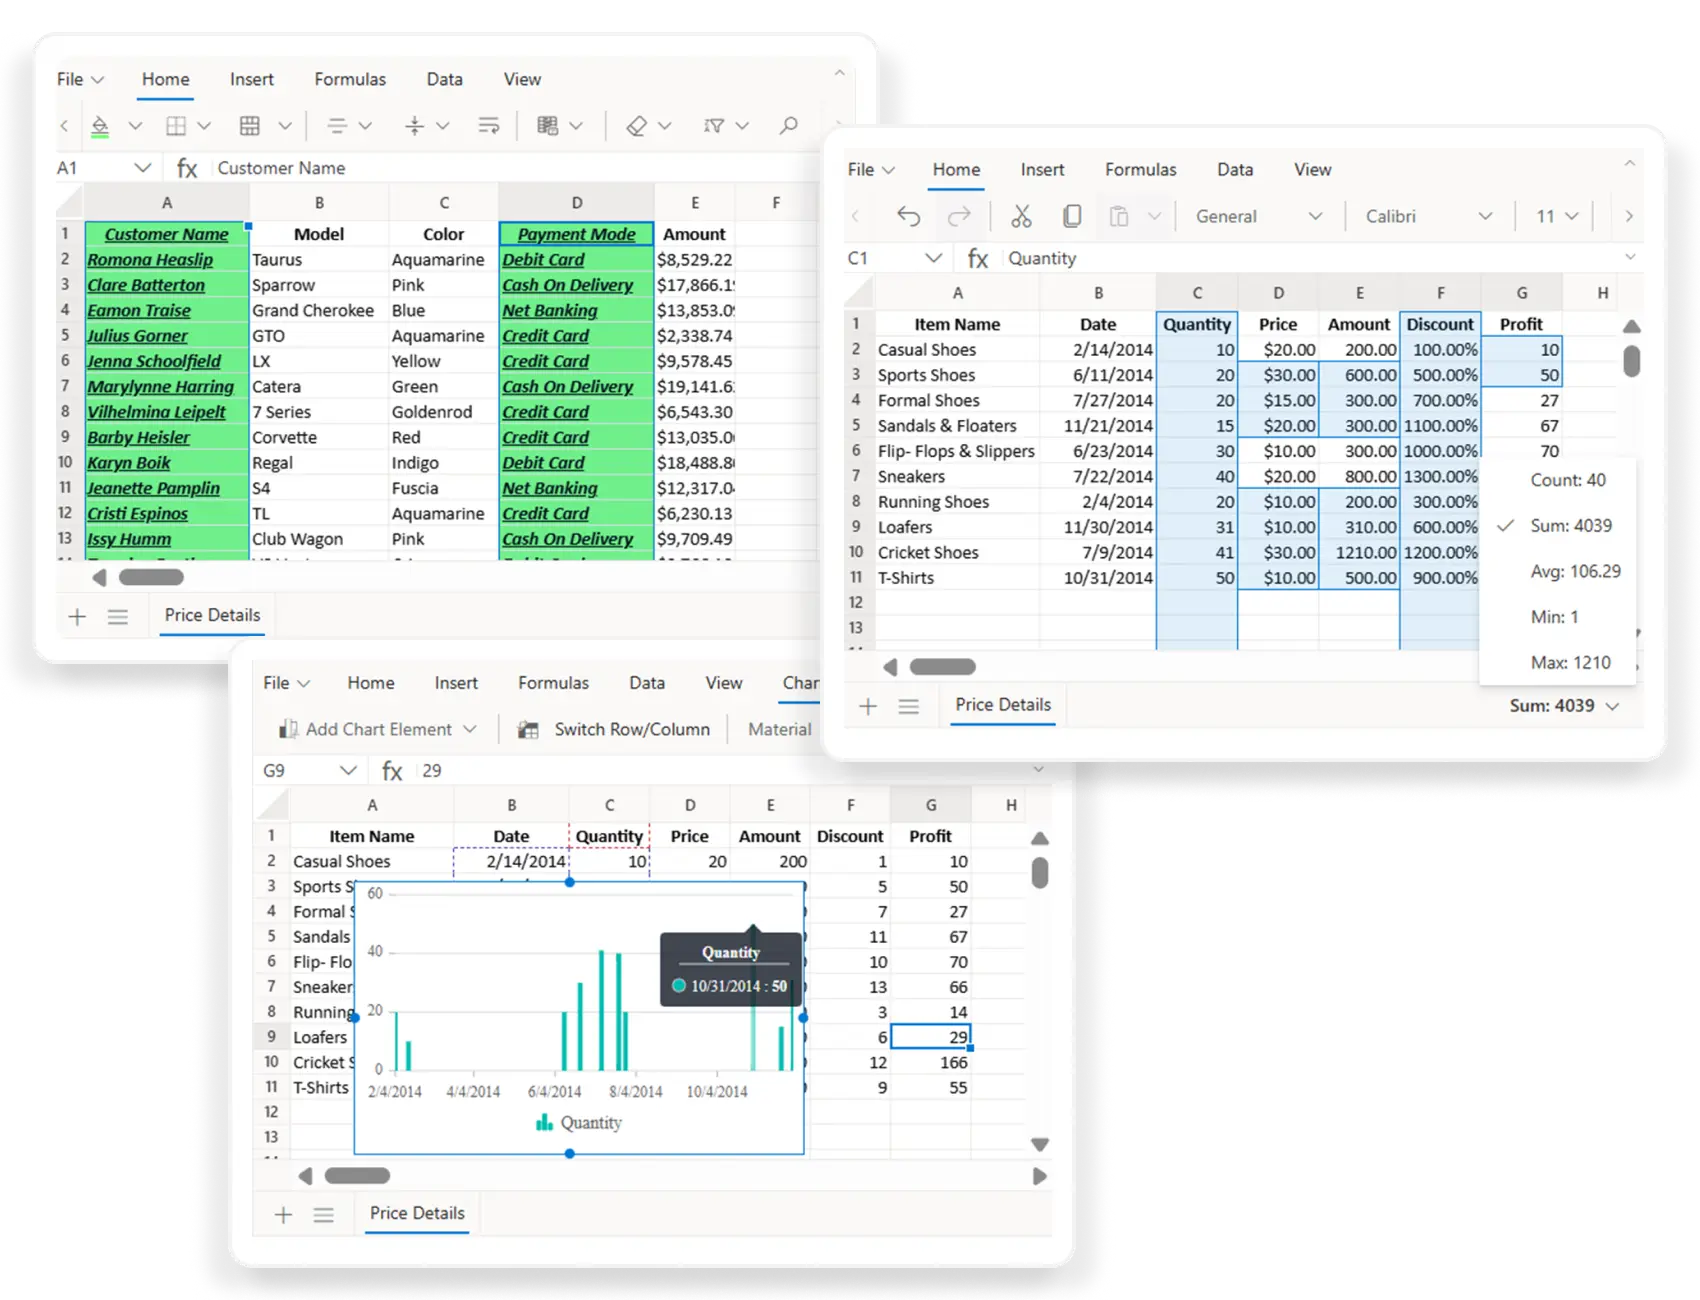
Excel-Like Editing & Data Analysis
- Discontinuous chart ranges for flexible data visualization.
- Improved clipboard operations preserve formulas and cell references.
- VS Code extension with ready-to-use Blazor Spreadsheet Editor templates.
FREE PRODUCT
Metro Studio
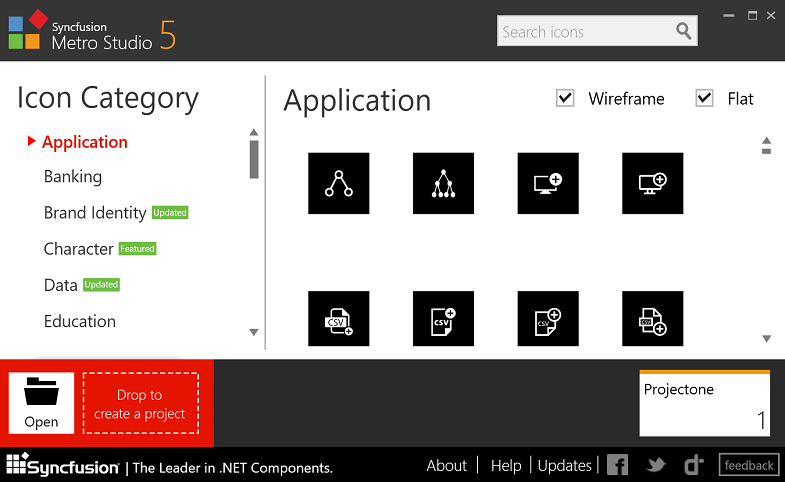
Large collection of icons
- Wide variety of wireframe icons
- Save and export support
- Export icon fonts