Build a Real-Time KPI Dashboard in .NET MAUI Using Charts and MVVM
 ChatGPT
 Perplexity
 Claude
 Grok
GrokTL;DR: Create a real-time KPI dashboard in .NET MAUI with charts and MVVM architecture. This guide walks you through building a responsive XAML layout, binding dynamic data using observable collections, and implementing live updates for metrics such as revenue trends, leads by channel, and regional performance. Ideal for cross-platform apps that require fast, interactive data visualization.
In today’s fast-paced business world, decision-makers need instant access to accurate and actionable insights. Unfortunately, traditional static dashboards often fail to keep pace, leaving teams with outdated information and hindering critical decisions. The solution is a real-time KPI dashboard, one that continuously updates to reflect changes in revenue, sales leads, and regional performance. Powered by dynamic data streaming and interactive visualizations, this approach ensures that insights are always current and relevant.
In this blog, we’ll learn how to build a sleek, real-time KPI dashboard using the Syncfusion® .NET MAUI Toolkit Charts and the MVVM pattern.
Core features of the KPI dashboard
To provide a clear and actionable view of business performance, the dashboard includes several key components:
- Revenue trend: A Line chart that illustrates revenue growth over time, helping you track performance and identify patterns.
- Units by channel: A Column chart that breaks down unit acquisition across different channels, offering insight into which sources contribute most to overall sales.
- Revenue by region: A Doughnut chart that highlights regional contributions to total revenue, making it easy to compare market performance.
- Dynamic insights: Quick metrics such as Momentum and Top Performers are displayed to deliver actionable insights at a glance.
Step 1: Dashboard layout design
To begin, we’ll create a clean and responsive KPI workspace using a two-column, four-row grid in .NET MAUI. This structure organizes dashboard components logically while maintaining flexibility across devices.
Refer to the following code example.
<ContentPage …>

    <Grid RowDefinitions="Auto,Auto,Auto,Auto" ColumnDefinitions="3*,2*" RowSpacing="12" ColumnSpacing="12">
        <!-- Header -->
        <Border Grid.Row="0" Grid.ColumnSpan="2" Style="{StaticResource Card}">
            <Label Text="Real-Time KPI Dashboard" Style="{StaticResource CardTitle}"/>
        </Border>

        <!-- Insight cards (3 columns) -->
        <Grid Grid.Row="1" Grid.ColumnSpan="2" ColumnDefinitions="*,*,*">
            <!-- 3 compact Border cards bound to Insights[0..2] -->
        </Grid>

        <!-- Charts -->
        <Border Grid.Row="2" Grid.Column="0" Style="{StaticResource Card}">
            <!-- Revenue Trend: Line Series -->
        </Border>

        <Border Grid.Row="3" Grid.Column="0" Style="{StaticResource Card}">
            <!-- Leads by Channel: Column Series -->
        </Border>

        <Border Grid.Row="2" Grid.RowSpan="2" Grid.Column="1" Style="{StaticResource Card}">
            <!-- Revenue by Region: Doughnut Series -->
        </Border>
    </Grid>
</ContentPage>
Step 2: Implement MVVM architecture
Moving forward, we’ll set up the MVVM (Model-View-ViewModel) architecture, which is essential for building scalable, maintainable, and testable .NET MAUI apps, especially dynamic dashboards. MVVM separates the UI (View) from the business logic (ViewModel) and data (Model), ensuring clean architecture and easier updates.
Creating model classes for chart data and insights
Model classes define the structure of your data, including time points for revenue trends, category totals for leads, insight items for quick metrics, and raw sales records for aggregation.
Refer to the following code example.
// Time series point (Line Series)
public class TimePoint
{
    public DateTime Time { get; set; }
    public double Value { get; set; }
    ...
}

// Category point (Column/Doughnut)
public class CategoryPoint
{
    public string Category { get; set; } = "";
    public double Value { get; set; }
    ...
}

// Insight card item
public class InsightItem
{
    public string Name { get; set; } = "";
    public string Value { get; set; } = "";
    public string Severity { get; set; } = "Info";
    public string Icon { get; set; } = "";
    ...
}

// Raw CSV record (Kaggle: Ascension merch supply chain)
public class SalesRecord
{
    public DateTime Date { get; set; }
    public string Channel { get; set; } = "";
    public string Region { get; set; } = "";
    public double UnitsSold { get; set; }
    public double Revenue { get; set; }
}
Step 3: Build the ViewModel for real-time updates
Next, we’ll create the ViewModel, which acts as the data bridge between the UI and models. It reads the CSV file once and seeds the dashboard, streams one record per day to simulate live data, aggregates revenue trends by day for smooth line charts, manages ObservableCollections for dynamic chart rendering, and supports real-time updates for all KPI components.
Refer to the following code example.
private async Task LoadCsvDataFromResourcesAsync(string fileNameInRaw)
{
    // Open CSV from app resources, validate headers, parse records, and sort by date.
}

private async Task StartRealtimeLoopAsync()
{
    // Run a timer loop on each tick, updating the UI until data ends or cancellation occurs.
}

private void UpdateRealtime()
{
    // Add the next record to the rolling window, drop out-of-range items, and trigger recompute.
}
Step 4: Create modular views with user controls
Finally, we’ll bring the dashboard to life by adding interactive charts that make your KPIs clear, actionable, and visually compelling. These visual components transform raw data into insights that are easy to interpret at a glance.
Revenue trend
Start by introducing a Line Chart to illustrate revenue changes over time. This visualization provides a smooth, continuous view of performance trends, allowing users to identify patterns and anomalies quickly. To keep the interface clean, enable tooltips for instant value checks without cluttering the interface.
Refer to the following code example.
<Chart:SfCartesianChart>
    <Chart:SfCartesianChart.XAxes>
        <Chart:DateTimeAxis />
    </Chart:SfCartesianChart.XAxes>

    <Chart:SfCartesianChart.YAxes>
        <Chart:NumericalAxis />
    </Chart:SfCartesianChart.YAxes>

    <Chart:LineSeries ItemsSource="{Binding RevenueTrend}"
                       XBindingPath="Time"
                       YBindingPath="Value"
                       StrokeWidth="2"
                       Fill="#0EA5E9"
                       ShowMarkers="False"
                       EnableTooltip="True" />
</Chart:SfCartesianChart>
Refer to the following image.
Leads by channel
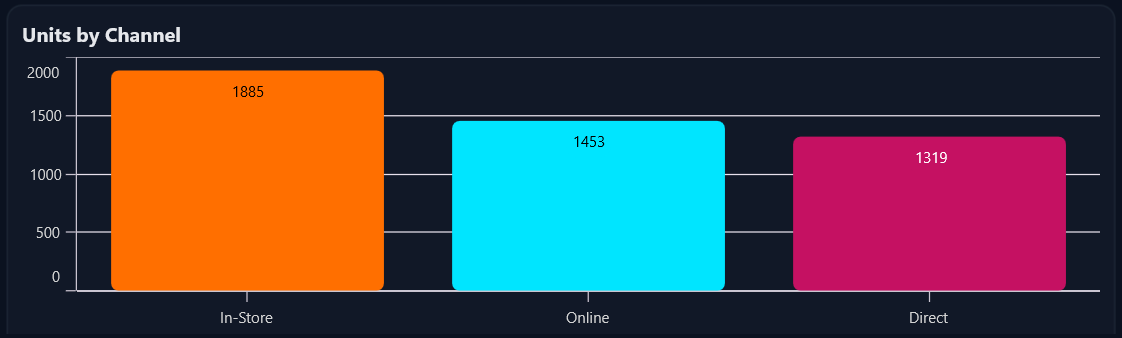
To compare performance across different channels, incorporate a Column Chart. This chart emphasizes category-based metrics, making it easy to spot strong and weak performers. Use clear data labels and custom colors to enhance readability and visual appeal.
Refer to the following code example.
<Chart:SfCartesianChart>
    <Chart:SfCartesianChart.XAxes>
        <Chart:CategoryAxis />
    </Chart:SfCartesianChart.XAxes>

    <Chart:SfCartesianChart.YAxes>
        <Chart:NumericalAxis />
    </Chart:SfCartesianChart.YAxes>

    <Chart:ColumnSeries ItemsSource="{Binding LeadsByChannel}"
                         XBindingPath="Category"
                         YBindingPath="Value"
                         CornerRadius="6"
                         ShowDataLabels="True"
                         EnableTooltip="True"
                         PaletteBrushes="{Binding LeadsBrushes}" />
</Chart:SfCartesianChart>
Refer to the following image.
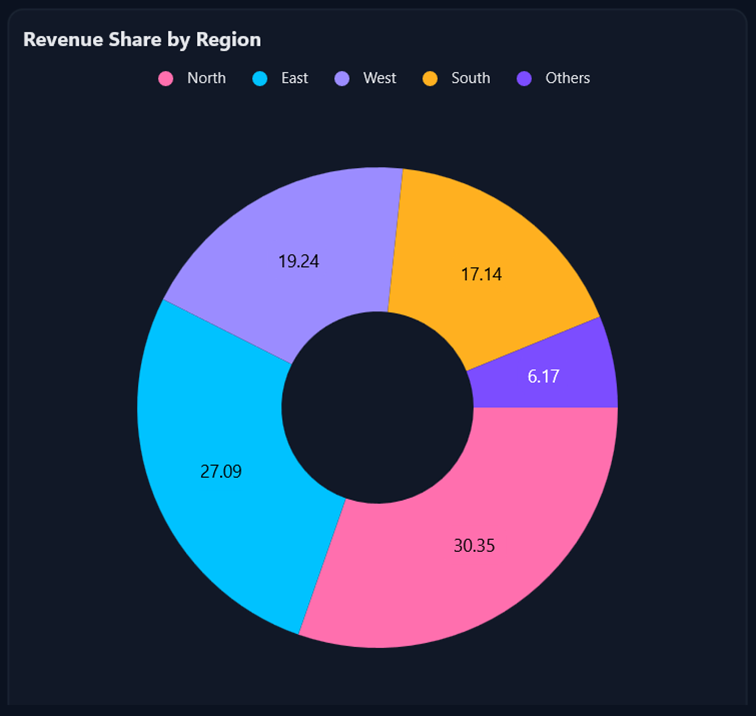
Revenue share by region
Next, visualize regional contributions with a Doughnut Chart. This chart highlights proportional data, making it ideal for understanding market distribution. Include data labels and a legend for clarity, and position labels outside the chart for a polished look.
Refer to the following code example.
<Chart:SfCircularChart>
    <Chart:DoughnutSeries ItemsSource="{Binding RevenueByRegion}"
                           XBindingPath="Category"
                           YBindingPath="Value"
                           ShowDataLabels="True"
                           EnableTooltip="True"
                           PaletteBrushes="{Binding CustomBrushes}">
        <Chart:DoughnutSeries.DataLabelSettings>
            <Chart:CircularDataLabelSettings Position="Outside" />
        </Chart:DoughnutSeries.DataLabelSettings>
    </Chart:DoughnutSeries>

    <Chart:SfCircularChart.Legend>
        <Chart:ChartLegend />
    </Chart:SfCircularChart.Legend>
</Chart:SfCircularChart>
Refer to the following image.
Insight cards
Finally, complement your charts with insight cards for quick-glance metrics. These cards reveal critical signals, including momentum, top-performing regions, and leading channels. Use color coding to indicate success or warnings, and concise text for instant comprehension.
Refer to the following code example.
<Border Style="{StaticResource InsightCard}">
    <Grid ColumnDefinitions="Auto,*" ColumnSpacing="16">
        <Path Data="M17…Z" Fill="Black" WidthRequest="40" HeightRequest="40" />
        <VerticalStackLayout>
            <Label Text="{Binding Insights[0].Value}" FontSize="20" FontAttributes="Bold" />
            <Label Text="{Binding Insights[0].Name}" FontSize="12" TextColor="#A5B4FC" />
        </VerticalStackLayout>
    </Grid>
</Border>
By following these steps, you’ll build the core of a dynamic, real-time KPI dashboard in .NET MAUI, utilizing charts and MVVM architecture, to deliver actionable insights across platforms.
GitHub reference
For more details, refer to the building KPI dashboards using .NET MAUI Toolkit Charts GitHub demo.
Conclusion
Thanks for following this dashboard walkthrough! You’ve learned how to build a clean, real-time KPI dashboard using .NET MAUI Toolkit Charts and the MVVM pattern. This approach ensures synchronized updates, modular design, and maintainable architecture. Feel free to extend the ViewModel, customize the charts, and adjust the layout to suit your specific metrics and application requirements.
Ready to elevate your .NET MAUI apps? Try Syncfusion charting components today and start visualizing volatility like a pro. Try out the steps discussed in this blog and leave your feedback in the comments section below.
If you’re a Syncfusion user, you can download the setup from the license and downloads page. Otherwise, you can download a free 30-day trial.
You can also contact us through our support forum, support portal, or feedback portal for queries. We are always happy to assist you!