Build a WPF Health Tracker Dashboard: Visualize Water Intake & Sleep Patterns with Interactive Charts
 ChatGPT
 Perplexity
 Claude
 Grok
GrokTL;DR: Want to turn your WPF app into a wellness dashboard? This post walks you through building a sleek, modular health tracker UI using Syncfusion Charts and MVVM. You’ll visualize hydration and sleep data with Bubble, Doughnut, and Column Charts, all wired up with clean XAML and real-time data binding.
Welcome to the Chart of the Week series!
We’re thrilled to take the WPF health tracker dashboard to the next level by introducing two powerful new modules: Water consumption and sleep tracking. These additions significantly broaden the dashboard’s capabilities, enabling users to monitor hydration and sleep quality alongside existing metrics like calories and steps.
Built with Syncfusion WPF Charts and a clean MVVM architecture, the new modules integrate seamlessly into the existing layout, preserving consistency and modularity for a smooth development experience.
Quick Recap: Phase 1
In the first phase, we established the core structure and functionality of the dashboard. The layout is organized into a three-row Grid, comprising a header, navigation tiles, and a dynamic content area. Two primary modules were introduced:
- Calories Tracker: Featuring Line and Doughnut Charts to visualize weekly intake and macronutrient breakdown.
- Steps Tracker: Using Column and nested Doughnut Charts to display daily activity metrics.
Each module was built using modular UserControls and ViewModels, adhering to MVVM principles for maintainability and scalability.
If you missed Phase 1, you can revisit the development of the calories and steps modules in our previous blog post.
Phase 2 expansion
In this phase, we’re introducing two new features:
Water Consumption Tracker
This module helps users monitor their daily hydration goals and weekly averages. Data is visualized using Column and Spline Charts, offering clear insights into water intake patterns.
Sleep Tracker
Designed to track sleep stages, REM, Deep, and Light, this module uses Bubble and Doughnut Charts to present sleep quality and distribution in an intuitive format.
Both modules are built on the same MVVM architecture and dashboard layout established in phase 1. The HealthDashboardViewModel has been extended to support these new features, and new models WaterEntry and SleepSession have been introduced to handle the underlying data.
For implementation details, including model and ViewModel classes, visit our GitHub repository.
Building the Modular Views with UserControls
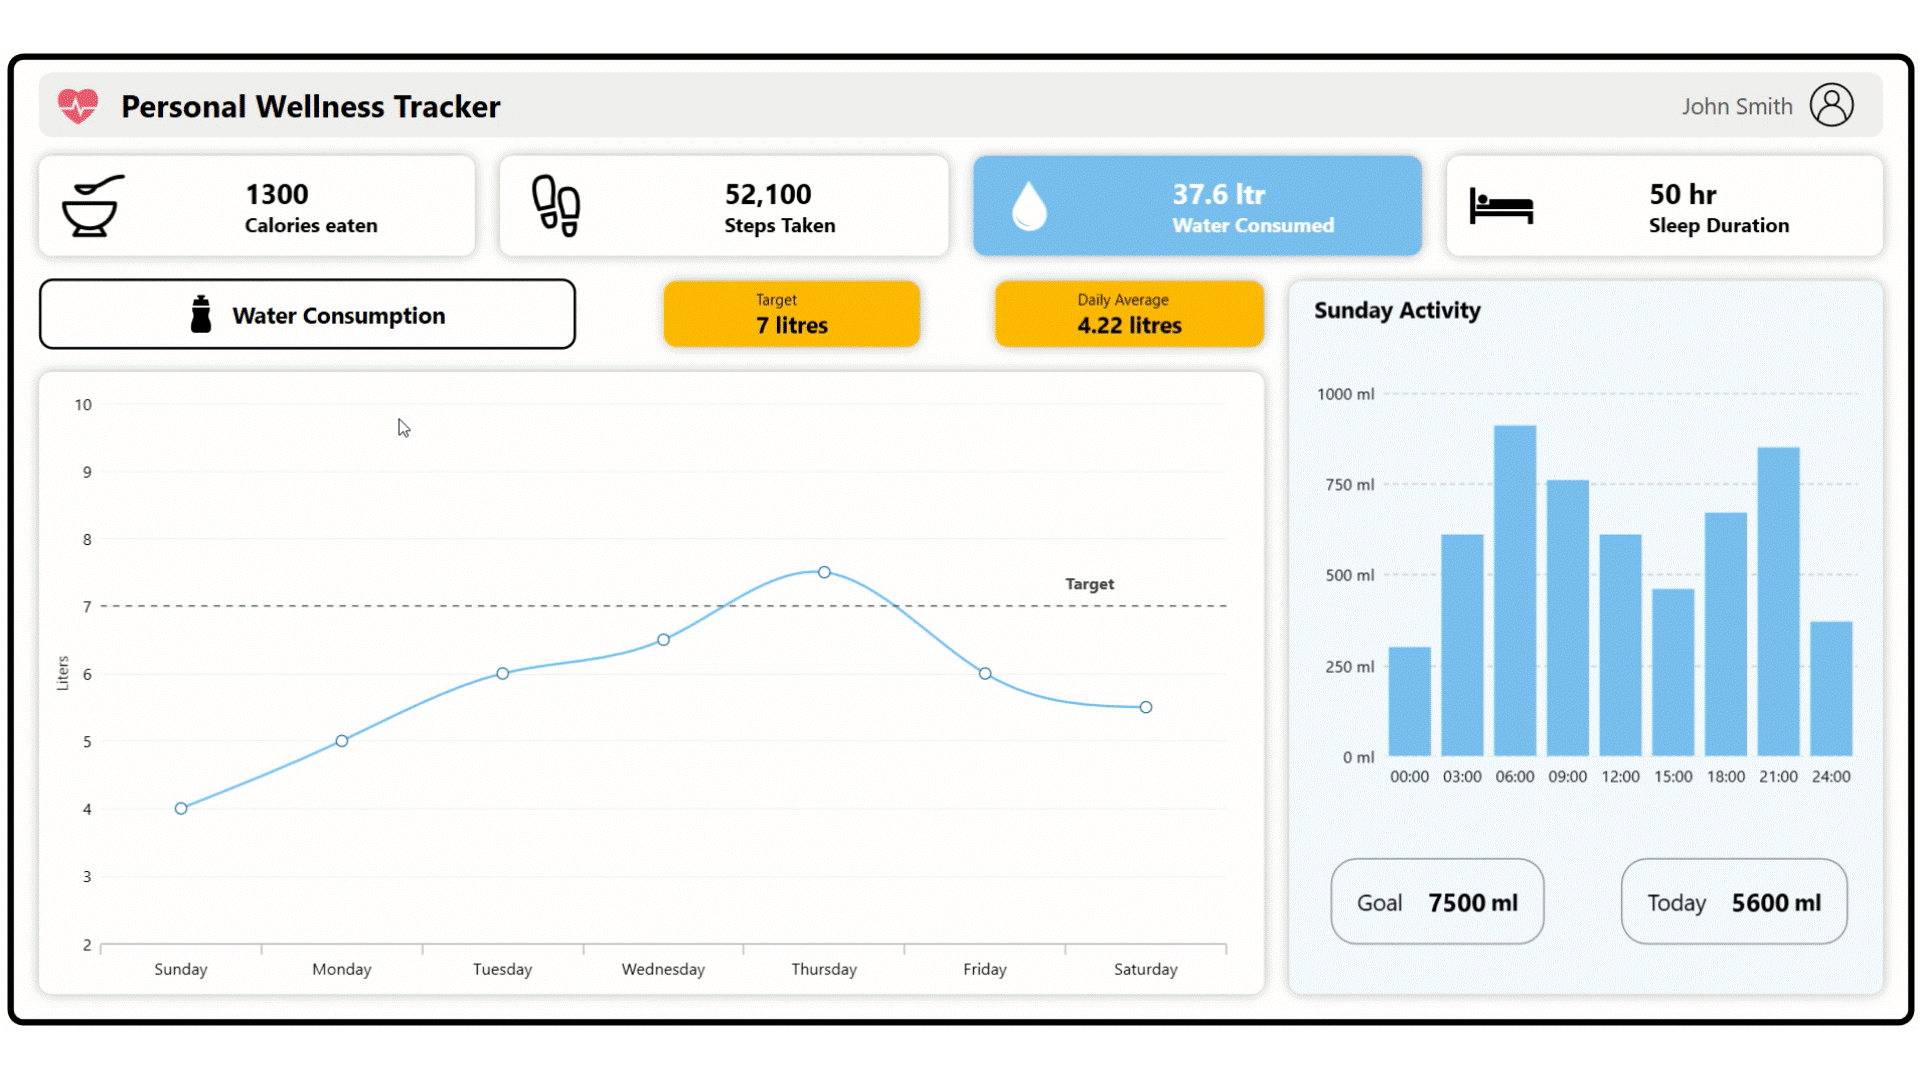
1. Water intake tracker
The water consumed page presents hydration data using structured visual components:
- Quick metrics: Displays the daily water target and weekly average.
- Weekly trend chart: Spline Chart with tooltip and an annotated target line.
- Activity panel: Hourly water intake distribution using a Column Chart, plus two progress cards summarizing daily goal completion and current consumption.
XAML
<UserControl x:Class="HealthAnalysisDashboard.WaterConsumed" …>
  <Grid>
    <Grid Grid.Row="1">
      <Grid.ColumnDefinitions>
        <ColumnDefinition Width="4*"/> <!-- Left analytics panel -->
        <ColumnDefinition Width="2*"/> <!-- Right summary panel -->
      </Grid.ColumnDefinitions>

      <!-- Left Panel -->
      <Grid Grid.Column="0">
        <Grid.RowDefinitions>
          <RowDefinition Height="1*"/> <!-- Header badges -->
          <RowDefinition Height="6*"/> <!-- Weekly spline chart -->
        </Grid.RowDefinitions>

        <!-- Header: Title + Target + Average -->
        <Grid Grid.Row="0">
        ...
        </Grid>

        <!-- Weekly Water Intake Spline Chart -->
        <Border Grid.Row="1">
          <syncfusion:SfChart>
            <!-- Category & Numerical Axes -->
            <!-- LineAnnotation for 7L goal -->
            <!-- SplineSeries with tooltip and markers -->
          </syncfusion:SfChart>
        </Border>
      </Grid>

      <!-- Right Panel -->
      <Border Grid.Column="1">
        <Grid>
         ...

          <!-- Title -->
          <TextBlock Grid.Row="0" Text="Sunday Activity"/>

          <!-- Hourly Water Intake Column Chart -->
          <syncfusion:SfChart Grid.Row="1">
            <!-- Category & Numerical Axes -->
            <!-- ColumnSeries with tooltip -->
          </syncfusion:SfChart>

          <!-- Goal vs Today Cards -->
          <Grid Grid.Row="2">
            <Grid.ColumnDefinitions>
              <ColumnDefinition/> <!-- Goal card -->
              <ColumnDefinition/> <!-- Today card -->
            </Grid.ColumnDefinitions>
          </Grid>
        </Grid>
      </Border>
    </Grid>
  </Grid>
</UserControl>
Note: For more details, refer to the water intake tracker UserControl on GitHub.
2. Sleep tracker
The sleep tracker page presents sleep data using structured visual components:
- Quick metrics: Displays sleep goals and daily average.
- Weekly trend chart: Bubble Chart where bubble size reflects sleep hours per day, with a tooltip for exact values.
- Sleep quality panel: Doughnut Chart showing total sleep hours at the center, with bedtime and wake time indicators. Four compact cards display Deep, Light, REM, and Awake durations.
XAML
<UserControl x:Class="HealthAnalysisDashboard.SleepDuration"...>

    <Grid Grid.Row="1">
        <Grid.ColumnDefinitions>
            <ColumnDefinition Width="4*"/><!-- Left panel: weekly chart -->
            <ColumnDefinition Width="2*"/><!-- Right panel: sleep quality -->
        </Grid.ColumnDefinitions>

        <!-- Left Panel -->
        <Grid Grid.Column="0">
            <Grid.RowDefinitions>
                <RowDefinition/><!-- Header badges -->
                <RowDefinition/><!-- Weekly bubble chart -->
            </Grid.RowDefinitions>

            <!-- Header: Title + Goal + Average -->
            <Grid Grid.Row="0">
                <Grid.ColumnDefinitions>
                    <ColumnDefinition Width="2*"/> <!-- Title -->
                    <ColumnDefinition Width="*"/><!-- Goal badge -->
                    <ColumnDefinition Width="*"/><!-- Daily average badge -->
                </Grid.ColumnDefinitions>
            </Grid>

            <!-- Weekly Sleep Bubble Chart -->
            <Border Grid.Row="1">
                <syncfusion:SfChart>
                    <!-- Category & Numerical Axes -->
                    <!-- BubbleSeries with tooltip -->
                </syncfusion:SfChart>
            </Border>
        </Grid>

        <!-- Right Panel -->
        <Border Grid.Column="1">
            <Grid>
               ...

                <!-- Title: Sleep Quality -->
                <TextBlock Grid.Row="0" Text="Sleep Quality"/>

                <!-- Doughnut Chart -->
                <syncfusion:SfChart Grid.Row="1">
                    <!-- DoughnutSeries with center view and tooltip -->
                </syncfusion:SfChart>

                <!-- Bedtime / Wake Time Labels -->
                <StackPanel Grid.Row="2" Orientation="Horizontal">
                    <!-- Labels -->
                </StackPanel>

                <!-- Sleep Phase Cards -->
                <Grid Grid.Row="3">
                    <UniformGrid Columns="2" Rows="2">
                        <!-- Awake -->
                        <!-- REM -->
                        <!-- Deep -->
                        <!-- Light -->
                    </UniformGrid>
                </Grid>
            </Grid>
        </Border>
    </Grid>
</UserControl>
Note: For more details, refer to the sleep tracker UserControl on GitHub.
Navigation and visual feedback
Just like in phase 1, each dashboard tile in phase 2 is implemented as a Border element with a MouseDown event handler.
XAML
...
<!-- Navigation tiles row -->
<Grid Grid.Row="1">
    ...

    <!-- Water Consumed Tile -->
    <Border Grid.Column="2" x:Name="waterConsumedBorder" MouseDown="waterConsumed_MouseDown" ...>
        <Grid>
            ...
        </Grid>
    </Border>

    <!-- Sleep Tracker Tile -->
    <Border Grid.Column="3" x:Name="sleepDurationBorder" MouseDown="sleepDuration_MouseDown" ...>
        <Grid>
            ...
            <Path ... />
            <StackPanel Grid.Column="1" ...>
                <TextBlock Text="..." />
                <TextBlock Text="Sleep Duration" />
            </StackPanel>
        </Grid>
    </Border>
</Grid>
...
C#
// In MainWindow.xaml.cs
...

private void sleepDuration_MouseDown(object sender, MouseButtonEventArgs e)
{
    SetViewAndHighlight(
        new SleepDuration(),
        sleepDurationBorder,
        "#AE75DA",
        sleepDurationValue,
        sleepDurationLabel,
        sleepDuration
    );
}

private void waterConsumed_MouseDown(object sender, MouseButtonEventArgs e)
{
    SetViewAndHighlight(
        new WaterConsumed(),
        waterConsumedBorder,
        "#77BEF0",
        waterConsumedValue,
        waterConsumedLabel,
        waterConsumed
    );
}
By following these steps, you’ve successfully extended the personal wellness tracker in WPF using Syncfusion Charts, adding advanced modules for hydration and sleep tracking. These enhancements feature interactive Spline, Bubble, and Doughnut Charts, delivering deeper wellness insights and a more engaging user experience.
GitHub reference
For more details, refer to the complete project on the GitHub demo.
Conclusion
Thanks for reading! With phase 2 complete, we’ve expanded the personal wellness tracker dashboard by adding two new modules, water intake and sleep tracking, leveraging Syncfusion WPF Charts for real-time hydration and sleep quality insights.
If you’re a Syncfusion user, you can download the setup from the license and downloads page. Otherwise, you can download a free 30-day trial.
You can also contact us through our support forum, support portal, or feedback portal for queries. We are always happy to assist you!