We use cookies to give you the best experience on our website. If you continue to browse, then you agree to our privacy policy and cookie policy.


The .NET MAUI Maps control is a powerful data visualization component that displays statistical information for a geographical area. Its rich feature set includes tile rendering from OpenStreetMap, Bing Maps, Google Maps, and other tile providers. The shape layer has highly interactive and customizable features such as selection, tooltip, legends, markers, bubbles, and color mapping. Users can generate maps to determine population density, sales, political boundaries, weather, elections, and routes.
Easily get started with the .NET MAUI Maps using a few simple lines of XAML code example as demonstrated below. Also explore our .NET MAUI Maps Example that shows you how to render the Maps control in .NET MAUI.
<?xml version="1.0" encoding="utf-8" ?>
<ContentPage xmlns="http://schemas.microsoft.com/dotnet/2021/maui"
             xmlns:x="http://schemas.microsoft.com/winfx/2009/xaml"
             x:Class="SimpleSample.MainPage"
             xmlns:local="clr-namespace:SimpleSample"
             xmlns:map="clr-namespace:Syncfusion.Maui.Maps;assembly=Syncfusion.Maui.Maps">
    <map:SfMaps>
<map:SfMaps.Layer>
<map:MapShapeLayer ShapesSource="https://cdn.syncfusion.com/maps/map-data/world-map.json"
                   ShapeStroke="DarkGrey">
</map:MapShapeLayer>
</map:SfMaps.Layer>
</map:SfMaps>
</ContentPage>Render GeoJSON or shapefile data into custom maps or geographical area shapes on a shape layer for powerful data visualization. Customize the maps to the desired look using built-in options.

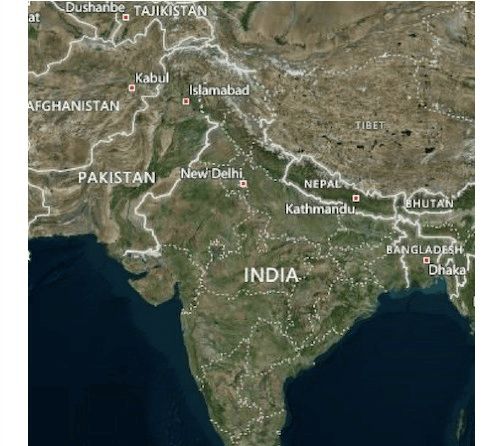
An interactive tile layer allows you to load and customize map tiles from web map-tile services such as OpenStreetMaps, Bing Maps API, Google Maps Tile API, TomTom, Mapbox, Esri’s ArcGIS. Use markers to denote a specific latitude and longitude in the tile layer as required. Zoom and pan the tile layer to navigate across the regions and take a closer look.
Data labels in a shape layer provide basic information about shapes by displaying their names and more. If required, trim or hide the labels when they exceed the shape bounds.


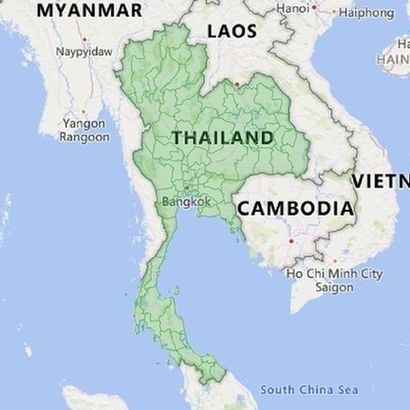
Highlight a shape to focus attention to a specific area. Use this functionality to navigate pages and show detailed information about a selected area.
Show markers for a shape layer with specific latitudes and longitudes. Use multiple markers to denote important locations in the .NET MAUI Maps. Use built-in marker icons such as circles, diamonds, rectangles, and triangles. As a custom marker, you can use any type of content, from a label control for displaying simple text to any type of content. Update the marker position dynamically to the desired location in scenarios like real-time location updates. Use a marker’s tap or click interaction for custom functionalities such as navigation, custom info window, and more depending on the application scenario.

Show markers for a shape layer with specific latitudes and longitudes.
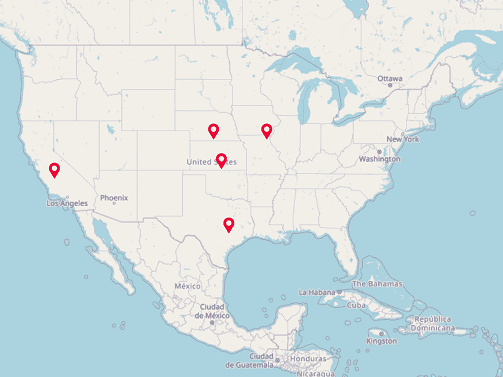
Show markers for a tile layer with specific latitudes and longitudes.
Legends in the shape layer convey clear information on data plotted in the .NET MAUI Maps control using shape and bubble colors.

Shape legends effectively presents distinct details for any data depicted in the .NET MAUI Maps control through the use of shapes.

The Bubble legends presents precise information regarding the data represented using bubbles.

Move a legend to any of the four sides (top, left, bottom, and right) on a map.
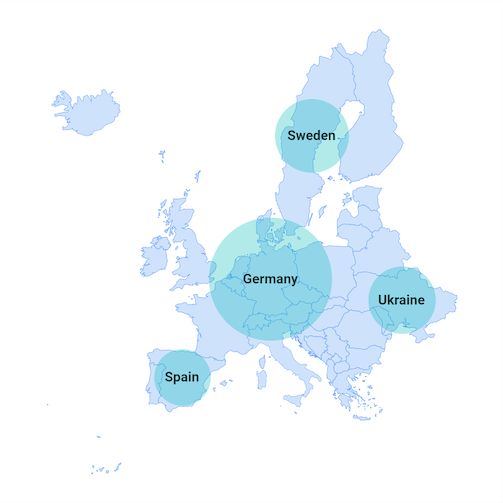
Categorize the shapes on a map by customizing their color based on their underlying data. The .NET MAUI Maps control supports two types of color mapping: equal and range.

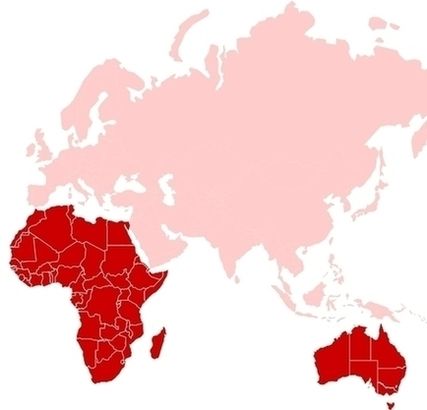
Apply a specific color to a shape purely based on its data. For example, apply colors to countries based on their organization membership.

Apply colors to shapes if their data falls within a specific range. For example, apply colors to countries based on their population density.
Add information to shapes, such as population density and number of users. Bubbles can be rendered in different colors and sizes based on the settings of their assigned shape.

Customize the color of a map bubble and its transparency based on data.
Customize the size of a bubble based on data to improve the readability of the map.
Add tooltips to show more information about shapes, bubbles, and markers when you tap, click, or hover (in desktop) on them.

Shape Tooltip displays shape information when interacting with shapes.

Bubble Tooltip serves the purpose of displaying bubble information whenever you engage with the bubbles.

Show tooltips for markers every time you engage with the markers within .NET MAUI Maps.
Add vector shapes such as lines, polylines, arcs, circles, and polygons on both the shape layer and tile layer to show routes and highlight specific regions.

Add vector shapes on top of the shape layer to show routes and highlight specific.
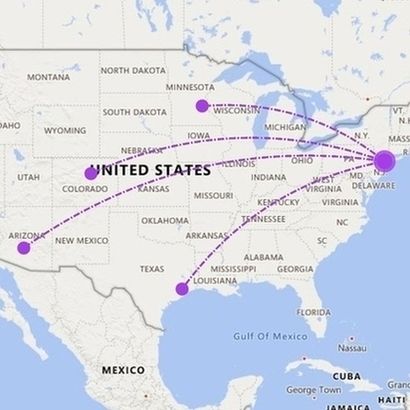
Add vector shapes on top of the tile layer to show routes and highlight specific.

Add circles on the shape layer and tile layer. Every single Map Circle renders a circle using center and radius.

Add polygons on the shape layer and tile layer. Every single polygon connects multiple coordinates through a points property.
Add a shape sublayer with GeoJSON data in another shape layer or tile layer to show more details about a particular region.
On shape layer contains collection of Map Sublayer, where you can add a shape layer as a sublayer of another shape layer.
On tile layer contains collection of Map Sublayer, where you can add a shape layer as a sublayer of the tile layer.
Zoom in any layer for a closer look at a specific region by pinching, scrolling the mouse wheel, or track pad. Pan the map to navigate across regions. Zooming and panning can be enabled for both the shape layer and the tile layer.


Greatness—it’s one thing to say you have it, but it means more when others recognize it. Syncfusion is proud to hold the following industry awards.


