We use cookies to give you the best experience on our website. If you continue to browse, then you agree to our privacy policy and cookie policy.

Axes in a Cartesian chart play a vital role in identifying the value of the visualized data. Charts typically have two axes that are used to measure and categorize data: a vertical axis (y-axis) and a horizontal axis (x-axis).
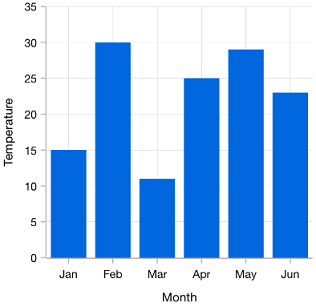
The vertical axis always uses a numerical scale. The horizontal axis supports the following scale types:
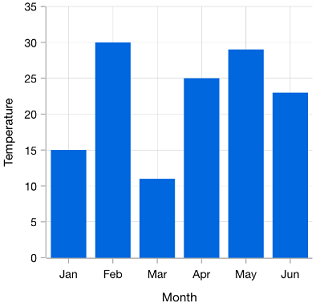
The categorical axis is a nonlinear axis that displays text in axis labels.
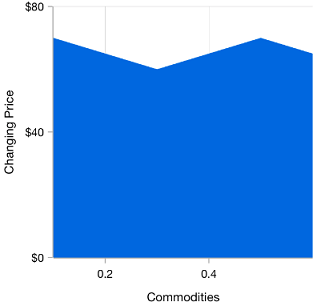
The numerical axis is a linear axis that displays numbers with an equal interval in axis labels.
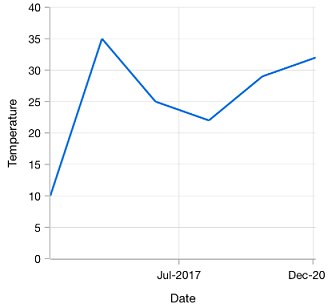
The date-time axis displays date-time values with an equal interval in axis labels. It is typically used as an x-axis.

Uses a logarithmic scale and displays numbers in labels.

Nonlinear date-time axis that accepts date-time values and renders data based on its index.

Axis being rendered in the opposite side of the default position.
The best possible axis ranges and intervals are calculated automatically based on the given values. The ranges can also be further customized using range padding.

The position of the axis can be moved anywhere in the chart relative to its associated axis.

Add multiple panes to a chart.

Charts provides many customization options for axis labels, including positioning, placement, label format, and rotation. It also has options to avoid labels overlapping.

A scale break is a stripe drawn chart area of a to denote a break in continuity of data points. This allows users to view different ranges in the same chart area without having a huge space in the plot area.
Use multiple axes to plot different data sets along two or more axes having different data points and values.

The values in an axis are inverted. Data on an inverted axis is plotted in the opposite direction–top to bottom for Y-axis and right to left for X-axis.
 You are using an outdated version of Internet Explorer that may not display all features of this and other websites. Upgrade to Internet Explorer 8 or newer for a better experience.