Performance and Scalability
The Syncfusion React Data Grid supports enterprise-scale data workloads, including large datasets, frequent real-time updates, and complex data operations. The Data Grid uses viewport-based rendering, virtualization mechanisms, and server-side processing to maintain consistent UI responsiveness as data size and interaction complexity increase.
Rendering performance modes
The Data Grid supports multiple rendering strategies that optimize how rows and columns are rendered and updated within the DOM. These modes address different data access patterns, including large row datasets, wide column layouts, incremental data loading, and server-driven operations.
Mode combinations: Row and column virtualization can be enabled together for datasets with both large row counts and wide column layouts. Immutable mode is compatible with both row virtualization and infinite scrolling, since change‑detection and data‑loading mechanisms operate independently. Infinite scrolling and row virtualization are mutually exclusive. Choose based on whether users navigate sequentially or jump across the dataset.
Performance benchmarks
Syncfusion publishes documented performance benchmarks for the React Data Grid that demonstrate behavior under large-dataset workloads and common data operations. The benchmark scenarios include measured results for initial Data Grid load, sorting, filtering, grouping, searching, and DOM element counts during rendering. These measurements provide concrete reference points for performance budgeting, scalability planning, and enterprise architecture documentation.
Benchmark scenario
Testing environment
- Component: Syncfusion React Data Grid (2026 Volume 1, 33.1.44)
- Framework: React (production build)
- Browser: Google Chrome 122.x (Blink rendering engine)
- Operating system: Windows 11 (64‑bit)
- Hardware: AMD Ryzen 5 7530U processor, 16 GB RAM, AMD Radeon graphics
- Measurement methodology: Performance timings were measured using the Data Grid’s action lifecycle events on a 100,000‑row by 12‑column dataset, capturing the duration from operation start to completion of the corresponding UI update.
Disclaimer: Actual performance may vary based on hardware, browser version, viewport size, data volume, column configuration, enabled Data Grid features, and application configuration.
Live performance benchmark sample
Explore this interactive benchmark sample to measure sorting, filtering, searching, grouping, and initial load performance using a large dataset. The sample provides real-time metrics that help validate Data Grid responsiveness in practical scenarios. Note that performance metrics may vary depending on the testing environment.
Benchmark results
The following table presents the benchmark results for the Syncfusion React Data Grid, based on the testing environment, highlighting execution times for key data operations such as initial load, sorting, filtering, searching, grouping, and their corresponding clear actions. These benchmarks are measured on a large, fully interactive grid with extensive rows and columns, along with customized templates, evaluated across different data handling modes including paging, infinite scrolling, and virtual scrolling. The results reflect realistic enterprise scenarios with high data volumes and frequent user interactions, rather than simplified test environments.
Server-side operations
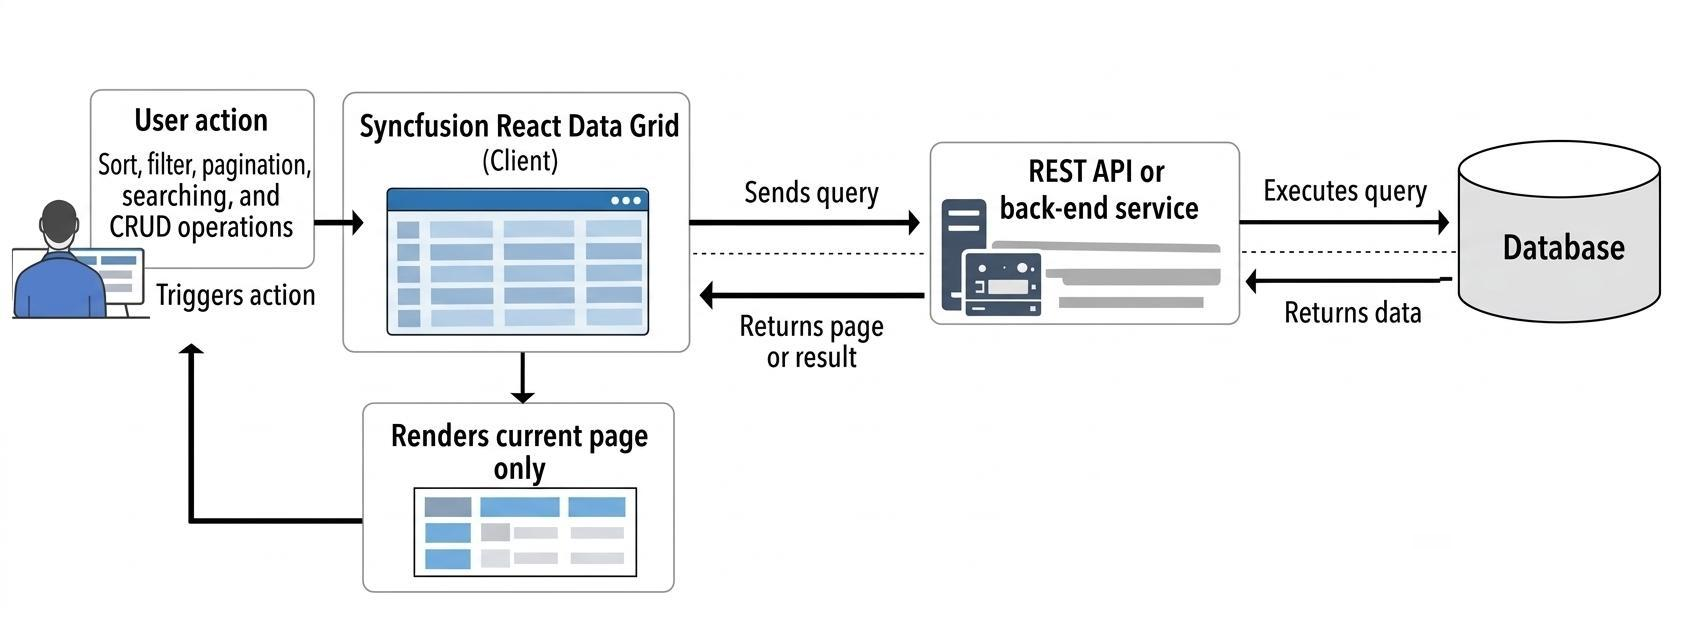
The Data Grid supports server-executed data operations through API-driven query parameters. This architecture enables applications to operate on datasets that exceed browser memory limits and supports environments where full dataset transfer to the client is not permitted for compliance or security reasons. The Data Grid requests only the data required for the current view while delegating computation to the back-end system.
Figure: Server-side operations flow
Real-time update performance
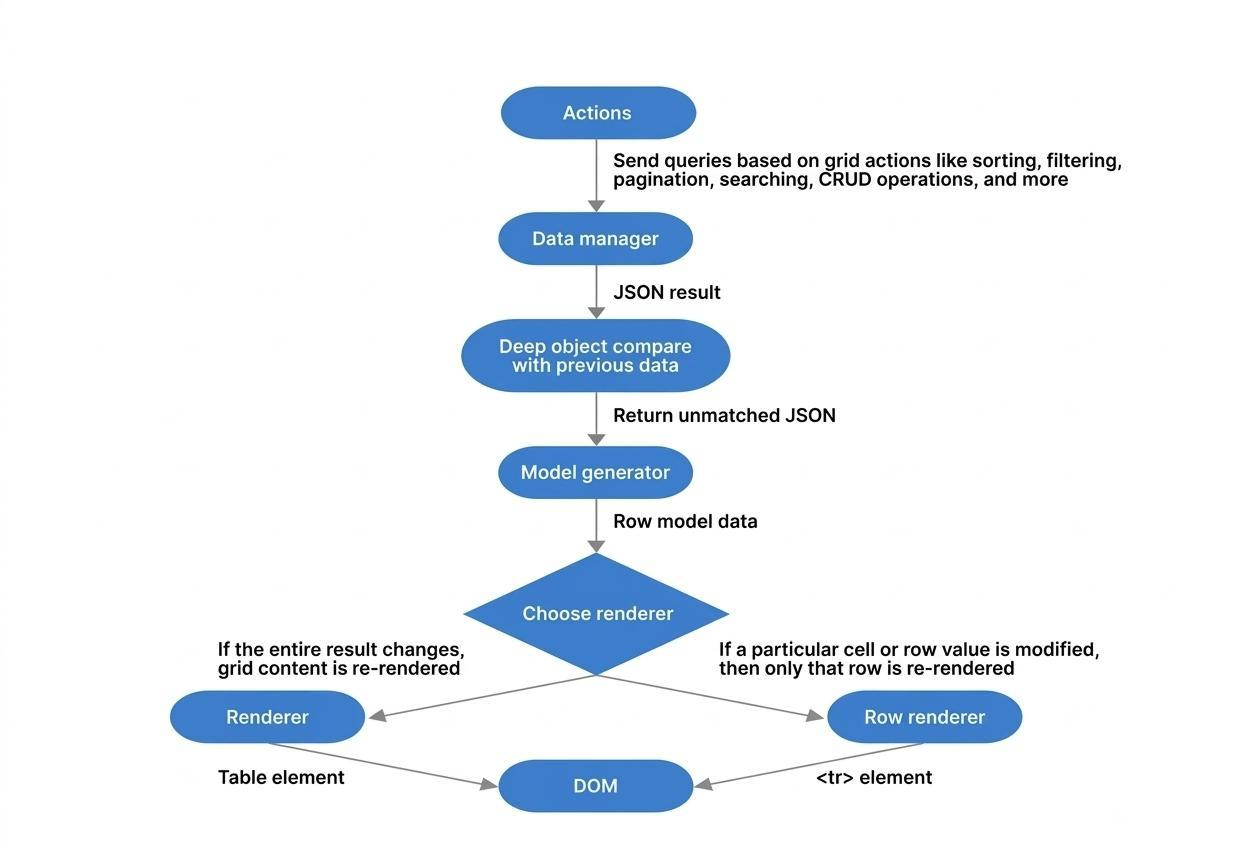
The Data Grid supports high-frequency real-time data updates for applications such as financial trading feeds, IoT monitoring dashboards, and operational control panels. The Data Grid includes an immutable rendering mode that enables efficient change detection, allowing the interface to update continuously without triggering full Data Grid re-render cycles. This design minimizes DOM mutations and preserves UI stability during sustained update streams.
Figure: Immutable re-rendering flow
DOM efficiency
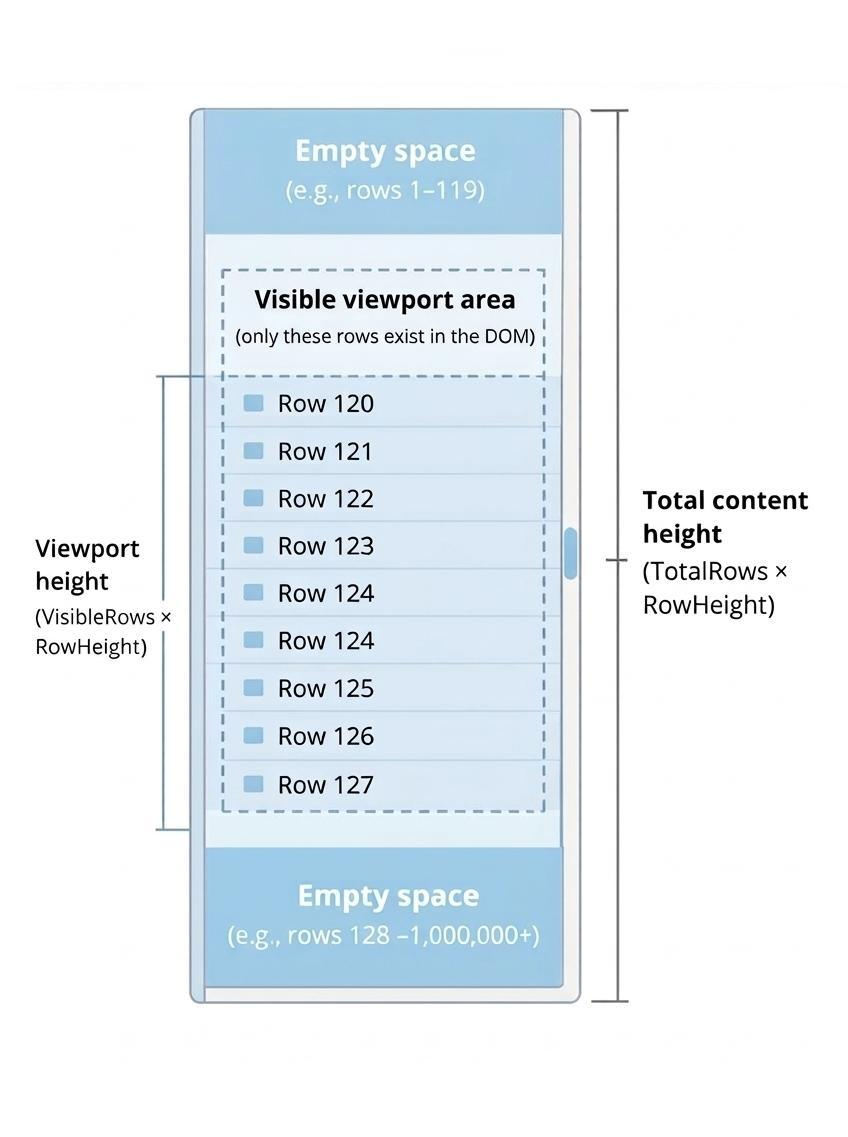
The Data Grid maintains a constant DOM footprint through viewport-based rendering. Only rows visible in the viewport are present in the DOM at any time, regardless of the total dataset size. This architecture prevents browser memory growth, reduces layout recalculation cost, and maintains consistent scrolling performance even when datasets scale to hundreds of thousands or millions of records. DOM behavior can be directly observed through browser developer tools.
Figure: DOM footprint under virtualization
Scalability beyond row count
Enterprise Data Grid scalability extends beyond dataset size to include column volume, concurrent Data Grid instances, dynamic schema changes, and complex dashboard layouts. The Syncfusion React Data Grid’s virtualization architecture operates across both rows and columns, enabling large datasets and wide tables to render efficiently while maintaining predictable browser memory usage. Multiple Data Grid instances can operate independently within the same page without sharing a rendering state or multiplying DOM cost.