Syncfusion React Data Grid — Enterprise Architecture Overview
Enterprise data grids are foundational components in modern business applications, supporting operational dashboards, financial reporting, case management, inventory tracking, and large-scale transactional workflows. As application complexity increases, the grids must continue to deliver high performance, secure data handling, flexible integration, and a consistent user experience across large and frequently changing datasets.
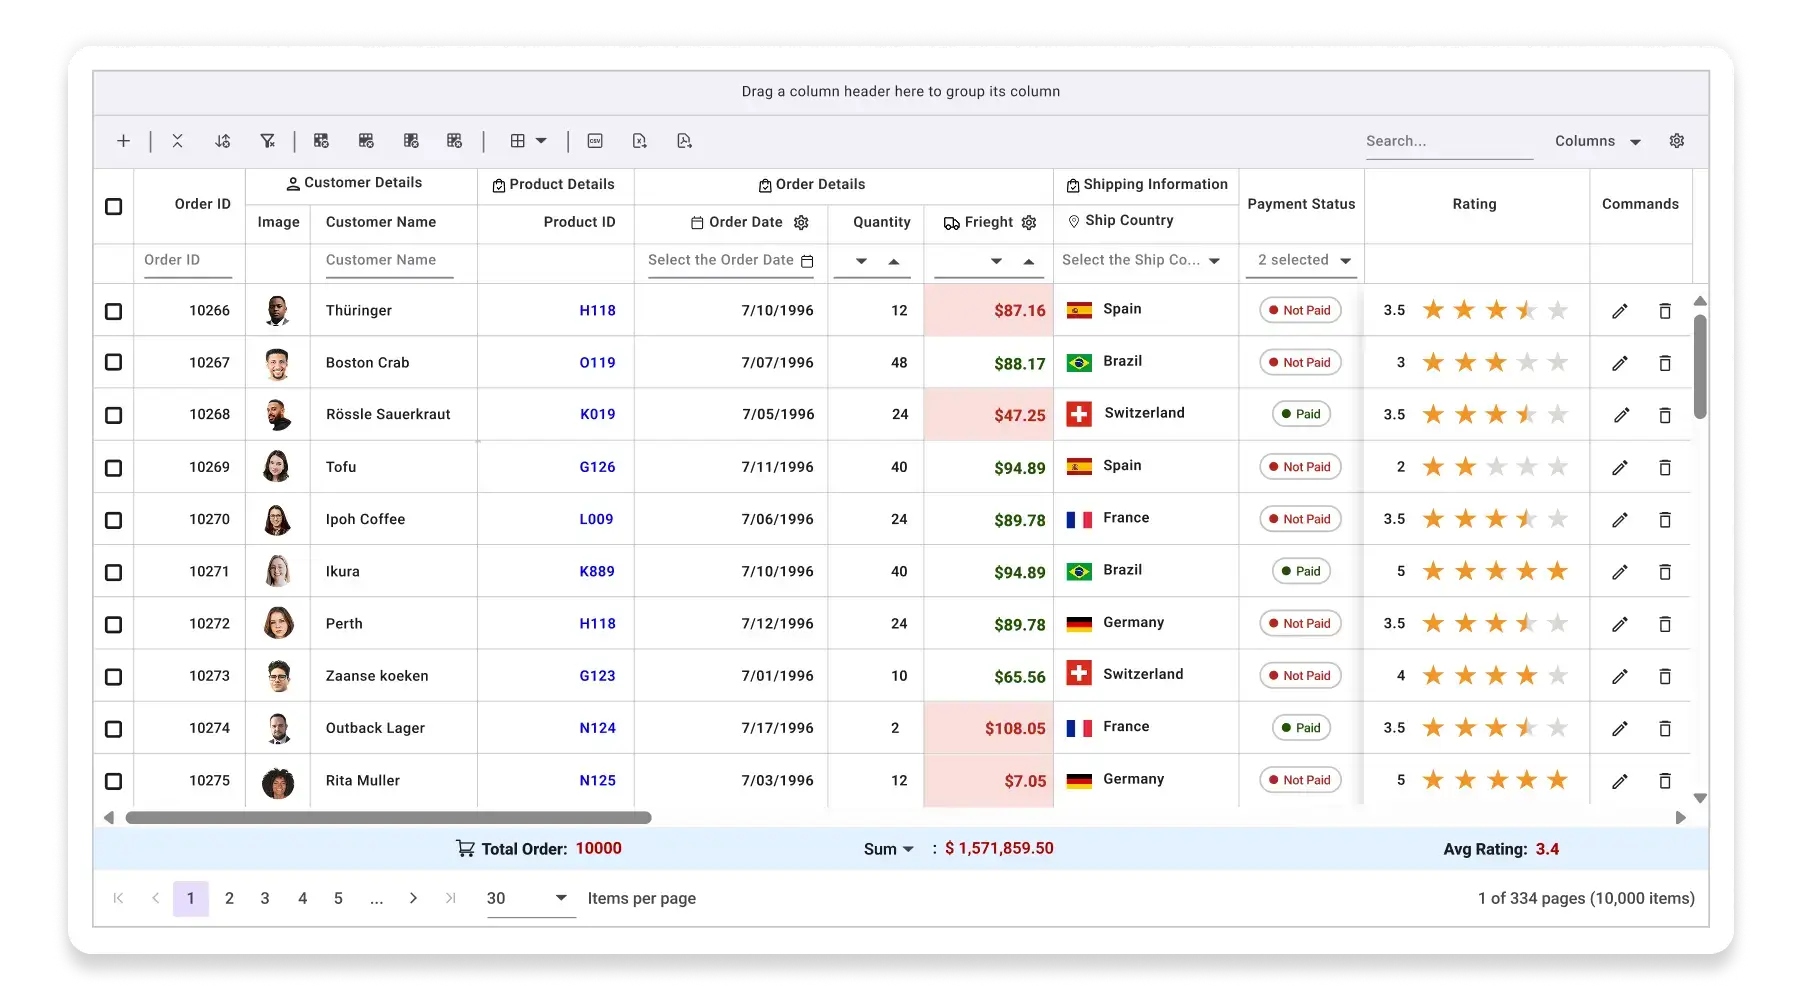
The Syncfusion React Data Grid is designed for these enterprise requirements. It provides a scalable rendering architecture with virtualization and flexible integration patterns for local and remote data sources. It supports advanced interaction scenarios, including sorting, filtering, grouping, aggregation, inline editing, batch updates, and real-time refresh. The component also includes built-in accessibility, localization, responsive layout behavior, export capabilities, and more to help organizations meet enterprise usability, compliance, and reporting requirements.
The following sections document the Data Grid’s architecture, supported integration patterns, scalability characteristics, and verified behavioral characteristics to assist decision makers in evaluating the component for enterprise adoption.
AI and extensibility
The Data Grid supports custom cell renderers, toolbar extensions, and event hooks that allow AI-assisted features, such as semantic filtering and anomaly highlighting, to be integrated as application-layer extensions. The Data Grid itself does not ship an AI runtime or call any external AI service; AI capabilities are wired in by the application and routed through the application's own backend or model endpoints. AI features inherit the same data-flow boundaries as the Data Grid.
Typical enterprise usage scenarios
The Data Grid is commonly used in applications where structured data must be presented, edited, and analyzed in large volumes.
Examples include:
- Financial trading dashboards displaying real-time market data.
- Logistics and supply-chain management systems.
- Healthcare record management interfaces.
- Operational analytics dashboards.
- Administrative tools used by internal enterprise teams.
In these environments, the Data Grid acts as both a data visualization layer and a data editing interface, requiring predictable performance and reliable interaction behavior under heavy workloads. Each scenario places different demands on the Data Grid: real-time trading requires high-frequency update throughput; healthcare records require strict field-level access control and audit capture; analytics dashboards require server-side aggregation and exporting.
Architectural capabilities
The Syncfusion React Data Grid provides a compact set of architectural capabilities for enterprise applications:
- Viewport-based rendering (row and column virtualization) to keep the DOM footprint predictable across very large datasets.
- Server-driven data operations (paging, sorting, filtering, grouping, aggregation) for datasets that cannot be fully transferred to the browser.
- Immutable and incremental update handling to support high-frequency real-time feeds without full Data Grid re-renders.
- Flexible editing workflows (inline, dialog, batch) with hooks for validation and auditing.
- Accessibility and internationalization support (WCAG 2.2 AA, ARIA roles, RTL).
- Template-based rendering for domain-specific UI in cells, headers, and toolbars.
- Built-in exporting (Excel and PDF) and server-side exporting options for very large datasets.
- Integration patterns for REST/OData, GraphQL, and real-time streams; compatible with Redux/RTK, Zustand, MobX, and TanStack Query — the Data Grid is a controlled component driven by props, with no internal global state.