Integration and Extensibility Model
Syncfusion React Charts is designed to fit into existing enterprise system architectures. It connects to the organization's data sources, respecting its state management layer, aligning with its design system, and integrating with the application’s existing security model without requiring major architectural changes. This document covers the data source integration model, authentication passthrough, versioning and API stability, extensibility points, state management compatibility, programmatic API surface, and multi-instance runtime behavior.
Data source integration
The Charts component connects to back-end data sources through the data manager and adaptor architecture. An adaptor acts as a built-in translation layer that converts Charts actions such as data load and series-level data queries into the request format that the back end expects and maps the API response back into a format Charts can render. For standard back-end patterns, the built-in adaptors minimize or eliminate manual request and response handling.
The adaptor is selected based on the back-end pattern already in use.
For nonstandard back ends, the custom adaptor extends any of these adaptors by intercepting and reshaping requests and responses. Common use cases include custom field name mapping, special auth headers, and token injection per request.
Database integration
The Charts component does not connect to databases from the client side. All data access goes through back-end API endpoints. The following table maps each major database to its recommended adaptors.
Authentication passthrough
Authentication headers, including JWT Bearer tokens, are configurable on the data manager and applied to every request automatically, covering the Charts operations data load (initial fetch) and series-level data queries.
Refer to our documentation on custom headers and applying middleware logic via the data manager.
Versioning and API stability
The Charts component follows semantic versioning. All public properties, events, methods, and template APIs are part of the stable public API surface.
Extensibility model
The Charts component exposes all visual layers as configurable extension points that accept standard React components. All extension points use documented public APIs, so customizations remain stable across version upgrades without requiring source-level changes to the Charts. Custom components placed in any template slot are rendered by React. Charts does not use innerHTML or dangerouslySetInnerHTML to mount them. Custom components are rendered through React. Applications should validate and sanitize any user-provided content rendered inside templates or annotations.
Typical extension points include the following.
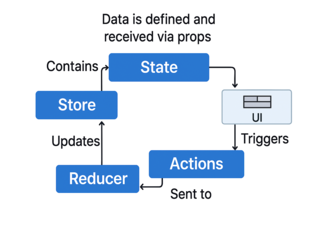
State management compatibility
Charts operates as a pure presentation component. It accepts data through a standard prop and returns user actions as events. It does not introduce a global store, context provider, or parallel data layer into the application. Any React state management library already in use connects to Charts without refactoring the existing state architecture.
Compatibility matrix
Programmatic API: Events and methods
Charts' Event and Method APIs give the application complete control over Chart behavior at every stage—before, during, and after execution. All events and method signatures are fully typed and published in a versioned API reference. It provides an extensive set of properties that allow complete control over its behavior.
Multichart and micro front-end runtime behavior
Each Charts instance operates in full isolation. It maintains its own state, event pipeline, data adaptor, and rendering lifecycle independently of any other Charts instance on the same page or across micro front-end modules. No state or behavior is shared across instances unless the application explicitly coordinates them through its own state layer.
Explore the micro front-end architecture blog to understand why and how micro front-end architectures are used in modern applications.