How To Create Custom Column In Winforms Datagrid?


This repositories contains the samples to create custom column in WinForms DataGrid (SfDataGrid).
You can create a new column by deriving GridColumn and create new a cell renderer by overriding the predefined renderer in DataGrid. The following steps describe how to create a sparkline column as a custom column.
Creating custom column
You can create a custom column by overriding a new class from the GridColumn class.
C
public class GridSparklineColumn : GridColumn
{
    /// <summary>
    /// Initializes a new instance of the <see cref="GridSparklineColumn"/> class.
    /// </summary>
    public GridSparklineColumn()
    {
        SetCellType("Sparkline");
        this.SparklineType = SparkLineType.Line;
    }

    /// <summary>
    /// Gets or sets the type of the sparkline control.
    /// </summary>
    public SparkLineType SparklineType { get; set; }
}
VB
Public Class GridSparklineColumn
    Inherits GridColumn
    ''' <summary>
    ''' Initializes a new instance of the <see cref="GridSparklineColumn"/> class.
    ''' </summary>
    Public Sub New()
        SetCellType("Sparkline")
        Me.SparklineType = SparkLineType.Line
    End Sub

    ''' <summary>
    ''' Gets or sets the type of the sparkline control.
    ''' </summary>
    Public Property SparklineType() As SparkLineType
End Class
Creating renderer
After creating a custom column, you need to create renderer for the custom column. You can create custom renderer by deriving the GridCellRendererBase class.
C
/// <summary>
/// Represents a class that used for drawing the spark line cell.
/// </summary>
public class GridSparklineCellRenderer : GridCellRendererBase
{
    /// <summary>
    /// Initializes a new instance of the <see cref="GridSparklineCellRenderer"/> class.
    /// </summary>
    /// <param name="sparkline">The sparkline.</param>
    /// <param name="dataGrid">The DataGrid.</param>
    public GridSparklineCellRenderer(Syncfusion.Windows.Forms.Chart.SparkLine sparkline, SfDataGrid dataGrid)
    {
        Sparkline = sparkline;
        DataGrid = dataGrid;
        IsEditable = false;
    }

    /// <summary>
    /// Gets or sets to specify the datagrid.
    /// </summary>
    protected SfDataGrid DataGrid { get; set; }

    /// <summary>
    /// Gets the sparkline control used to draw the sparkline.
    /// </summary>
    protected SparkLine Sparkline { get; set; }

    ///<summary>
    ///Renders the line type sparkline.
    ///</summary>
    ///<param name="graphics">The <see cref="System.Windows.Forms.PaintEventArgs"/> instance containing the event data.</param>
    ///<param name="sparkline">The Sparkline.</param>
    public void DrawSparkline(Graphics graphics, Syncfusion.Windows.Forms.Chart.SparkLine sparkline)
    {
        SparkLineSource sparkLineSource = new SparkLineSource();
        int areaMarginX = 3;
        int areaMarginY = 3;
        double firstPointX = 0, firstPointY = 0, secondPointX = 0, secondPointY = 0;
        double areaWidth = sparkline.ControlWidth - areaMarginX * areaMarginX;
        double areaHeight = sparkline.ControlHeight - areaMarginY * areaMarginY;

        var sourceList = (List<object>)sparkLineSource.GetSourceList(sparkline.Source, sparkline);

        if (sourceList.Count == 0)
            return;

        double lineInterval = areaWidth / (sourceList.Count);
        double lineRange = sparkline.HighPoint - sparkline.LowPoint;

        for (int i = 0; i < sourceList.Count; i++)
        {
            double Value = Convert.ToDouble(sourceList[i]) - sparkline.LowPoint;

            secondPointX = firstPointX;
            secondPointY = firstPointY;

            firstPointX = this.Sparkline.Location.X + (lineInterval * i + (lineInterval / 2));
            firstPointY = this.Sparkline.Location.Y + (areaHeight - (areaHeight * (Value / lineRange)));

            if (i > 0)
                graphics.DrawLine(new Pen(sparkline.LineStyle.LineColor, 1), (float)(areaMarginX + firstPointX), (float)(areaMarginY + firstPointY), (float)(areaMarginX + secondPointX), (float)(areaMarginY + secondPointY));

            if (sparkline.Markers.ShowMarker)
                graphics.FillEllipse(new SolidBrush(sparkline.Markers.MarkerColor.BackColor), (float)(areaMarginX + firstPointX - 2), (float)(areaMarginY + firstPointY - 2), 5, 5);
            if (Convert.ToDouble(sourceList[i]) == sparkline.StartPoint && sparkline.Markers.ShowStartPoint)
                graphics.FillEllipse(new SolidBrush(sparkline.Markers.StartPointColor.BackColor), (float)(areaMarginX + firstPointX - 2), (float)(areaMarginY + firstPointY - 2), 5, 5);
            if (Convert.ToDouble(sourceList[i]) == sparkline.EndPoint && sparkline.Markers.ShowEndPoint)
                graphics.FillEllipse(new SolidBrush(sparkline.Markers.EndPointColor.BackColor), (float)(areaMarginX + firstPointX - 2), (float)(areaMarginY + firstPointY - 2), 5, 5);

            if (sparkline.GetNegativePoint() != null)
            {
                int count = sparkline.GetNegativePoint().GetUpperBound(0);
                for (int k = 0; k <= count; k++)
                {
                    if (Convert.ToDouble(sourceList[i]) == (double)sparkline.GetNegativePoint().GetValue(k) && sparkline.Markers.ShowNegativePoint)
                        graphics.FillEllipse(new SolidBrush(sparkline.Markers.NegativePointColor.BackColor), (float)(areaMarginX + firstPointX - 2), (float)(areaMarginY + firstPointY - 2), 5, 5);
                }
            }

            if (Convert.ToDouble(sourceList[i]) == sparkline.HighPoint && sparkline.Markers.ShowHighPoint)
                graphics.FillEllipse(new SolidBrush(sparkline.Markers.HighPointColor.BackColor), (float)(areaMarginX + firstPointX - 2), (float)(areaMarginY + firstPointY - 2), 5, 5);
            if (Convert.ToDouble(sourceList[i]) == sparkline.LowPoint && sparkline.Markers.ShowLowPoint)
                graphics.FillEllipse(new SolidBrush(sparkline.Markers.LowPointColor.BackColor), (float)(areaMarginX + firstPointX - 2), (float)(areaMarginY + firstPointY - 2), 5, 5);
        }
    }

    /// <summary>
    /// Override to draw the spark line of the cell.
    /// </summary>
    /// <param name="graphics">The <see cref="T:System.Drawing.Graphics"/> that used to draw the spark line.</param>
    /// <param name="cellRect">The cell rectangle.</param>
    /// <param name="cellValue">The cell value.</param>
    /// <param name="style">The CellStyleInfo of the cell.</param>
    /// <param name="column">The DataColumnBase of the cell.</param>
    /// <param name="rowColumnIndex">The row and column index of the cell.</param>
    protected override void OnRender(Graphics graphics, Rectangle cellRect, string cellValue, CellStyleInfo style, DataColumnBase column, RowColumnIndex rowColumnIndex)
    {
        using (SolidBrush brush = new SolidBrush(style.BackColor))
            graphics.FillRectangle(brush, cellRect);

        var sparklineColumn = column.GridColumn as GridSparklineColumn;
        this.Sparkline = new Syncfusion.Windows.Forms.Chart.SparkLine();
        var record = this.DataGrid.GetRecordAtRowIndex(rowColumnIndex.RowIndex);

        this.Sparkline.Source = GetSparklineSource(column.GridColumn.MappingName, record);
        this.Sparkline.Type = sparklineColumn.SparklineType;
        this.Sparkline.Markers.ShowEndPoint = true;
        this.Sparkline.Markers.ShowHighPoint = true;
        this.Sparkline.Markers.ShowLowPoint = true;
        this.Sparkline.Markers.ShowMarker = true;
        this.Sparkline.Markers.ShowNegativePoint = true;
        this.Sparkline.Markers.ShowStartPoint = true;
        this.Sparkline.Size = cellRect.Size;
        this.Sparkline.Location = cellRect.Location;

        var smoothingMode = graphics.SmoothingMode;
        var clipBounds = graphics.VisibleClipBounds;
        graphics.SetClip(cellRect);
        graphics.SmoothingMode = System.Drawing.Drawing2D.SmoothingMode.HighQuality;
        if (this.Sparkline.Type == SparkLineType.Line)
            DrawSparkline(graphics, Sparkline);
        else if (this.Sparkline.Type == SparkLineType.Column)
            DrawSparkColumn(graphics, Sparkline);
        else
            DrawSparkWinLossColumn(graphics, Sparkline);

        graphics.SmoothingMode = smoothingMode;
        graphics.SetClip(clipBounds);
    }

    /// <summary>
    /// Occurs when a key is pressed while the cell has focus.
    /// </summary>
    /// <param name="dataColumn">The DataColumnBase of the cell.</param>
    /// <param name="rowColumnIndex">The row and column index of the cell.</param>
    /// <param name="e">The <see cref="T:System.Windows.Forms.KeyEventArgs"/> that contains the event data.</param>
    protected override void OnKeyDown(DataColumnBase dataColumn, RowColumnIndex rowColumnIndex, KeyEventArgs e)
    {
        var selectionController = this.DataGrid.SelectionController as CustomSelectionController;
        switch (e.KeyCode)
        {
            case Keys.Space:
            case Keys.Down:
            case Keys.Up:
            case Keys.Left:
            case Keys.Right:
            case Keys.Enter:
            case Keys.PageDown:
            case Keys.PageUp:
            case Keys.Tab:
            case Keys.Home:
            case Keys.End:
                selectionController.HandleKeyOperations(e);
                break;
        }

        base.OnKeyDown(dataColumn, rowColumnIndex, e);
    }

    /// <summary>
    /// Gets data to the sparkline column.
    /// </summary>
    /// <param name="mappingName">The mapping name of the column.</param>
    /// <param name="record">Data of the SparkLine.</param>
    /// <returns>returns collection.</returns>
    private double[] GetSparklineSource(string mappingName, object record)
    {
        var salesCollection = record as System.Data.DataRowView;
        var item = salesCollection.Row.ItemArray[5];
        return item as double[];
    }
}
VB
''' <summary>
''' Represents a class used for drawing the sparkline cell.
''' </summary>
Public Class GridSparklineCellRenderer
    Inherits GridCellRendererBase
    ''' <summary>
    ''' Initializes a new instance of the <see cref="GridSparklineCellRenderer"/> class.
    ''' </summary>
    ''' <param name="sparkline">The sparkline.</param>
    ''' <param name="dataGrid">The DataGrid.</param>
    Public Sub New(ByVal sparkline As Syncfusion.Windows.Forms.Chart.SparkLine, ByVal dataGrid As SfDataGrid)
        Me.Sparkline = sparkline
        Me.DataGrid = dataGrid
        IsEditable = False
    End Sub

    ''' <summary>
    ''' Gets or sets to specify the datagrid.
    ''' </summary>
    Protected Property DataGrid() As SfDataGrid

    ''' <summary>
    ''' Gets the sparkline control used to draw the sparkline.
    ''' </summary>
    Protected Property Sparkline() As SparkLine

    '''<summary>
    '''Renders the line type sparkline.
    '''</summary>
    '''<param name="graphics">The <see cref="System.Windows.Forms.PaintEventArgs"/> instance containing the event data.</param>
    '''<param name="sparkline">The Sparkline.</param>
    Public Sub DrawSparkline(ByVal graphics As Graphics, ByVal sparkline As Syncfusion.Windows.Forms.Chart.SparkLine)
        Dim sparkLineSource As New SparkLineSource()
        Dim areaMarginX As Integer = 3
        Dim areaMarginY As Integer = 3
        Dim firstPointX As Double = 0, firstPointY As Double = 0, secondPointX As Double = 0, secondPointY As Double = 0
        Dim areaWidth As Double = sparkline.ControlWidth - areaMarginX * areaMarginX
        Dim areaHeight As Double = sparkline.ControlHeight - areaMarginY * areaMarginY

        Dim sourceList = CType(sparkLineSource.GetSourceList(sparkline.Source, sparkline), List(Of Object))

        If sourceList.Count = 0 Then
            Return
        End If

        Dim lineInterval As Double = areaWidth / (sourceList.Count)
        Dim lineRange As Double = sparkline.HighPoint - sparkline.LowPoint

        For i As Integer = 0 To sourceList.Count - 1
            Dim Value As Double = Convert.ToDouble(sourceList(i)) - sparkline.LowPoint

            secondPointX = firstPointX
            secondPointY = firstPointY

            firstPointX = Me.Sparkline.Location.X + (lineInterval * i + (lineInterval / 2))
            firstPointY = Me.Sparkline.Location.Y + (areaHeight - (areaHeight * (Value / lineRange)))

            If i > 0 Then
                graphics.DrawLine(New Pen(sparkline.LineStyle.LineColor, 1), CSng(areaMarginX + firstPointX), CSng(areaMarginY + firstPointY), CSng(areaMarginX + secondPointX), CSng(areaMarginY + secondPointY))
            End If

            If sparkline.Markers.ShowMarker Then
                graphics.FillEllipse(New SolidBrush(sparkline.Markers.MarkerColor.BackColor), CSng(areaMarginX + firstPointX - 2), CSng(areaMarginY + firstPointY - 2), 5, 5)
            End If
            If Convert.ToDouble(sourceList(i)) = sparkline.StartPoint AndAlso sparkline.Markers.ShowStartPoint Then
                graphics.FillEllipse(New SolidBrush(sparkline.Markers.StartPointColor.BackColor), CSng(areaMarginX + firstPointX - 2), CSng(areaMarginY + firstPointY - 2), 5, 5)
            End If
            If Convert.ToDouble(sourceList(i)) = sparkline.EndPoint AndAlso sparkline.Markers.ShowEndPoint Then
                graphics.FillEllipse(New SolidBrush(sparkline.Markers.EndPointColor.BackColor), CSng(areaMarginX + firstPointX - 2), CSng(areaMarginY + firstPointY - 2), 5, 5)
            End If

            If sparkline.GetNegativePoint() IsNot Nothing Then
                Dim count As Integer = sparkline.GetNegativePoint().GetUpperBound(0)
                For k As Integer = 0 To count
                    If Convert.ToDouble(sourceList(i)) = CDbl(sparkline.GetNegativePoint().GetValue(k)) AndAlso sparkline.Markers.ShowNegativePoint Then
                        graphics.FillEllipse(New SolidBrush(sparkline.Markers.NegativePointColor.BackColor), CSng(areaMarginX + firstPointX - 2), CSng(areaMarginY + firstPointY - 2), 5, 5)
                    End If
                Next k
            End If

            If Convert.ToDouble(sourceList(i)) = sparkline.HighPoint AndAlso sparkline.Markers.ShowHighPoint Then
                graphics.FillEllipse(New SolidBrush(sparkline.Markers.HighPointColor.BackColor), CSng(areaMarginX + firstPointX - 2), CSng(areaMarginY + firstPointY - 2), 5, 5)
            End If
            If Convert.ToDouble(sourceList(i)) = sparkline.LowPoint AndAlso sparkline.Markers.ShowLowPoint Then
                graphics.FillEllipse(New SolidBrush(sparkline.Markers.LowPointColor.BackColor), CSng(areaMarginX + firstPointX - 2), CSng(areaMarginY + firstPointY - 2), 5, 5)
            End If
        Next i
    End Sub

    ''' <summary>
    ''' Overrides to draw the sparkline of the cell.
    ''' </summary>
    ''' <param name="graphics">The <see cref="T:System.Drawing.Graphics"/> that used to draw the spark line.</param>
    ''' <param name="cellRect">The cell rectangle.</param>
    ''' <param name="cellValue">The cell value.</param>
    ''' <param name="style">The CellStyleInfo of the cell.</param>
    ''' <param name="column">The DataColumnBase of the cell.</param>
    ''' <param name="rowColumnIndex">The row and column index of the cell.</param>
    Protected Overrides Sub OnRender(ByVal graphics As Graphics, ByVal cellRect As Rectangle, ByVal cellValue As String, ByVal style As CellStyleInfo, ByVal column As DataColumnBase, ByVal rowColumnIndex As RowColumnIndex)
        Using brush As New SolidBrush(style.BackColor)
            graphics.FillRectangle(brush, cellRect)
        End Using

        Dim sparklineColumn = TryCast(column.GridColumn, GridSparklineColumn)
        Me.Sparkline = New Syncfusion.Windows.Forms.Chart.SparkLine()
        Dim record = Me.DataGrid.GetRecordAtRowIndex(rowColumnIndex.RowIndex)

        Me.Sparkline.Source = GetSparklineSource(column.GridColumn.MappingName, record)
        Me.Sparkline.Type = sparklineColumn.SparklineType
        Me.Sparkline.Markers.ShowEndPoint = True
        Me.Sparkline.Markers.ShowHighPoint = True
        Me.Sparkline.Markers.ShowLowPoint = True
        Me.Sparkline.Markers.ShowMarker = True
        Me.Sparkline.Markers.ShowNegativePoint = True
        Me.Sparkline.Markers.ShowStartPoint = True
        Me.Sparkline.Size = cellRect.Size
        Me.Sparkline.Location = cellRect.Location

        Dim smoothingMode = graphics.SmoothingMode
        Dim clipBounds = graphics.VisibleClipBounds
        graphics.SetClip(cellRect)
        graphics.SmoothingMode = System.Drawing.Drawing2D.SmoothingMode.HighQuality
        If Me.Sparkline.Type = SparkLineType.Line Then
            DrawSparkline(graphics, Sparkline)
        ElseIf Me.Sparkline.Type = SparkLineType.Column Then
            DrawSparkColumn(graphics, Sparkline)
        Else
            DrawSparkWinLossColumn(graphics, Sparkline)
        End If

        graphics.SmoothingMode = smoothingMode
        graphics.SetClip(clipBounds)
    End Sub

    ''' <summary>
    ''' Occurs when the key is pressed while the cell has focus.
    ''' </summary>
    ''' <param name="dataColumn">The DataColumnBase of the cell.</param>
    ''' <param name="rowColumnIndex">The row and column index of the cell.</param>
    ''' <param name="e">The <see cref="T:System.Windows.Forms.KeyEventArgs"/> that contains the event data.</param>
    Protected Overrides Sub OnKeyDown(ByVal dataColumn As DataColumnBase, ByVal rowColumnIndex As RowColumnIndex, ByVal e As KeyEventArgs)
        Dim selectionController = TryCast(Me.DataGrid.SelectionController, CustomSelectionController)
        Select Case e.KeyCode
            Case Keys.Space, Keys.Down, Keys.Up, Keys.Left, Keys.Right, Keys.Enter, Keys.PageDown, Keys.PageUp, Keys.Tab, Keys.Home, Keys.End
                selectionController.HandleKeyOperations(e)
        End Select

        MyBase.OnKeyDown(dataColumn, rowColumnIndex, e)
    End Sub

    ''' <summary>
    ''' Gets data to the sparkline column.
    ''' </summary>
    ''' <param name="mappingName">The mapping name of the column.</param>
    ''' <param name="record">Data of the SparkLine.</param>
    ''' <returns>returns collection.</returns>
    Private Function GetSparklineSource(ByVal mappingName As String, ByVal record As Object) As Double()
        Dim salesCollection = TryCast(record, System.Data.DataRowView)
        Dim item = salesCollection.Row.ItemArray(5)
        Return TryCast(item, Double())
    End Function
Adding the custom renderer to CellRenderers collection
By using the following code, you can add the previous created custom renderer to the SfDataGrid.CellRenderers collection.
C
this.sfDataGrid1.CellRenderers.Add("Sparkline", new GridSparklineCellRenderer(new Syncfusion.Windows.Forms.Chart.SparkLine(), this.sfDataGrid1));
VB
Me.sfDataGrid1.CellRenderers.Add("Sparkline", New GridSparklineCellRenderer(New Syncfusion.Windows.Forms.Chart.SparkLine(), Me.sfDataGrid1))
Loading custom column
By using the following code, you can define the custom column in DataGrid.
C
this.sfDataGrid1.Columns.Add(new GridSparklineColumn() { MappingName = "Sparkline", HeaderText = "Analysis Report", Width = 150, AllowFiltering = false });
VB
Me.sfDataGrid1.Columns.Add(New GridSparklineColumn() With {.MappingName = "Sparkline", .HeaderText = "Analysis Report", .Width = 150, .AllowFiltering = False})
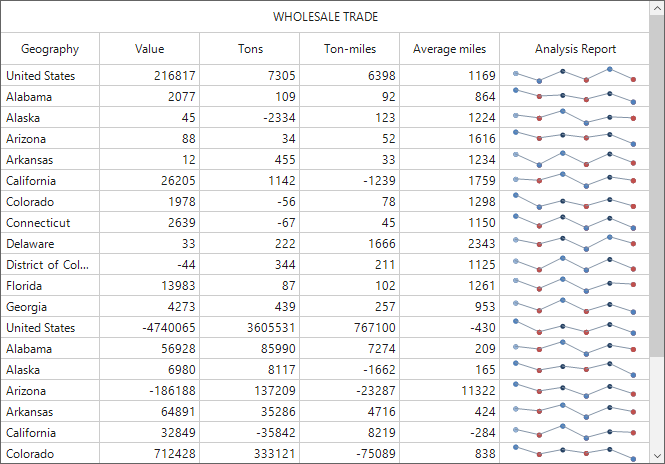
Here, a rating column has been created as a custom column. A sample for this is available in this repository.