Getting Started With Syncfusion Sfchart3d For UWP


This sample demonstrates how to create a UWP 3D chart application using the Syncfusion SfChart3D control. The SfChart3D control lets you visualize two-dimensional data in a three-dimensional view with support for rotation, data binding, animations, and interactivity.
Prerequisites
- Visual Studio 2022 with the Universal Windows Platform development workload installed.
- Windows 10 SDK (minimum version
10.0.17763.0). - A valid Syncfusion license or a free trial.
How to Run This Sample
- Clone or download this repository.
- Open
GettingStarted/ChartDemo.slnxin Visual Studio 2022. - Restore NuGet packages if prompted (right-click the solution ? Restore NuGet Packages).
- Set the target platform (e.g., x86 or x64) in the toolbar.
- Press F5 to build and run the application.
Step-by-Step: Creating a UWP SfChart3D from Scratch
Step 1: Create a UWP Project
- Open Visual Studio 2022.
- Select Create a new project.
- Choose Universal Windows App (UWP) and click Next.
- Enter the project name (e.g.,
ChartDemo) and click Create. - Set the Target version to Windows 10, version 1809 (10.0.17763) or later.
Step 2: Add the Syncfusion NuGet Package
- Right-click your project in Solution Explorer and select Manage NuGet Packages.
- In the Browse tab, search for
Syncfusion.SfChart.UWP. - Select the package and click Install.
Alternatively, add it directly to the .csproj file:
<PackageReference Include="Syncfusion.SfChart.UWP">
    <Version>*</Version>
</PackageReference>
Step 3: Add Syncfusion Namespace in XAML
Open MainPage.xaml and add the Syncfusion namespace declaration to the <Page> element:
xmlns:syncfusion="using:Syncfusion.UI.Xaml.Charts"
Step 4: Create the Data Model
Add a new class file Person.cs to define the data model:
namespace ChartDemo
{
    public class Person
    {
        public string Name { get; set; }

        public double Height { get; set; }
    }
}
Step 5: Create the ViewModel
Add a new class file ViewModel.cs to serve as the data source:
using System.Collections.Generic;

namespace ChartDemo
{
    public class ViewModel
    {
        public List<Person> Data { get; set; }

        public ViewModel()
        {
            Data = new List<Person>()
            {
                new Person { Name = "David",   Height = 180 },
                new Person { Name = "Michael", Height = 170 },
                new Person { Name = "Steve",   Height = 160 },
                new Person { Name = "Joel",    Height = 182 }
            };
        }
    }
}
Step 6: Initialize SfChart3D in XAML
Open MainPage.xaml and initialize the SfChart3D control. Set the DataContext, configure axes, add a legend, and bind a ColumnSeries3D to the data:
<Page
    x:Class="ChartDemo.MainPage"
    xmlns="http://schemas.microsoft.com/winfx/2006/xaml/presentation"
    xmlns:x="http://schemas.microsoft.com/winfx/2006/xaml"
    xmlns:local="using:ChartDemo"
    xmlns:d="http://schemas.microsoft.com/expression/blend/2008"
    xmlns:mc="http://schemas.openxmlformats.org/markup-compatibility/2006"
    xmlns:syncfusion="using:Syncfusion.UI.Xaml.Charts"
    mc:Ignorable="d">

    <!--Setting DataContext for SfChart3D-->
    <Page.DataContext>
        <local:ViewModel/>
    </Page.DataContext>

    <Grid Background="{ThemeResource ApplicationPageBackgroundThemeBrush}">

        <syncfusion:SfChart3D Header="Chart" Height="300" Width="500">

            <!--Initialize the horizontal axis for SfChart3D-->
            <syncfusion:SfChart3D.PrimaryAxis>
                <syncfusion:CategoryAxis3D Header="Name" FontSize="14"/>
            </syncfusion:SfChart3D.PrimaryAxis>

            <!--Initialize the vertical axis for SfChart3D-->
            <syncfusion:SfChart3D.SecondaryAxis>
                <syncfusion:NumericalAxis3D Header="Height(in cm)" FontSize="14"/>
            </syncfusion:SfChart3D.SecondaryAxis>

            <!--Adding Legend to the SfChart3D-->
            <syncfusion:SfChart3D.Legend>
                <syncfusion:ChartLegend/>
            </syncfusion:SfChart3D.Legend>

            <!--Initialize the ColumnSeries3D and bind data-->
            <syncfusion:ColumnSeries3D Label="Heights"
                                       ItemsSource="{Binding Data}"
                                       XBindingPath="Name"
                                       YBindingPath="Height"
                                       ShowTooltip="True">
                <syncfusion:ColumnSeries3D.AdornmentsInfo>
                    <syncfusion:ChartAdornmentInfo3D ShowLabel="True"/>
                </syncfusion:ColumnSeries3D.AdornmentsInfo>
            </syncfusion:ColumnSeries3D>

        </syncfusion:SfChart3D>

    </Grid>
</Page>
Key properties used:
| Property | Description |
|---|---|
Header |
Sets the title of the chart. |
PrimaryAxis |
Defines the horizontal (X) axis. CategoryAxis3D is used for string-based categories. |
SecondaryAxis |
Defines the vertical (Y) axis. NumericalAxis3D is used for numeric values. |
ItemsSource |
Binds the data collection to the series. |
XBindingPath |
Maps the X-axis data field from the model (Name). |
YBindingPath |
Maps the Y-axis data field from the model (Height). |
ShowTooltip |
Enables tooltip display on hover. |
ShowLabel |
Displays data labels on each segment via ChartAdornmentInfo3D. |
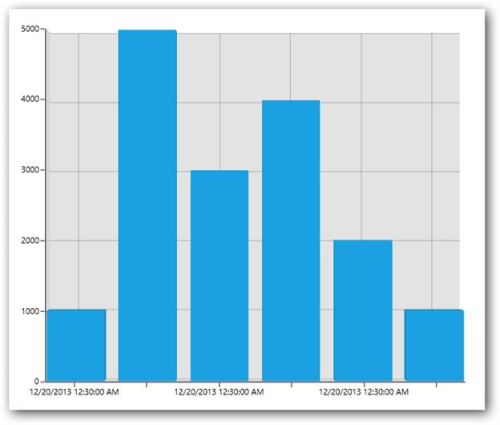
Output
The application renders a 3D column chart displaying the height of each person:
Project Structure
GettingStarted/
+-- ChartDemo.slnx
+-- ChartDemo/
    +-- App.xaml                  # Application entry point
    +-- App.xaml.cs
    +-- ChartDemo.csproj          # Project file with NuGet references
    +-- MainPage.xaml             # SfChart3D UI definition
    +-- MainPage.xaml.cs          # Code-behind for MainPage
    +-- Person.cs                 # Data model class
    +-- ViewModel.cs              # ViewModel with sample data
    +-- Assets/                   # Application assets (icons, splash screen)
    +-- Properties/
        +-- AssemblyInfo.cs
        +-- Default.rd.xml
Supported Series Types
SfChart3D supports the following series types:
- Column
- Bar
- Stacking Column
- Stacking Column 100
- Stacking Bar
- Stacking Bar 100
- Pie
- Doughnut
Key Features
- Eight series types for varied data visualization.
- Perspective view for a realistic 3D appearance.
- Data binding support using
ItemsSource,XBindingPath, andYBindingPath. - Animations on load and data updates.
- Dynamic rotation — rotate the chart using mouse or touch by enabling
EnableRotation="True". - Segment selection — highlight individual data points using
SegmentSelectionBrush. - Series selection — highlight an entire series using
EnableSeriesSelectionandSeriesSelectionBrush. - Dynamic explode — explode segments in circular (Pie/Doughnut) series using
ExplodeOnMouseClick. - Adornments — display data labels, markers, and connector lines on series segments.
- Empty point support for handling missing data gracefully.