We use cookies to give you the best experience on our website. If you continue to browse, then you agree to our privacy policy and cookie policy.

Axis in a Cartesian chart plays a vital role in identifying the value of the visualized data. Charts typically have two axes that are used to measure and categorize data, a vertical axis (y-axis) and a horizontal axis (x-axis).
The vertical axis always uses a numerical scale. The horizontal axis supports the following scale types:
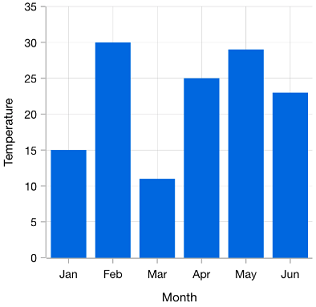
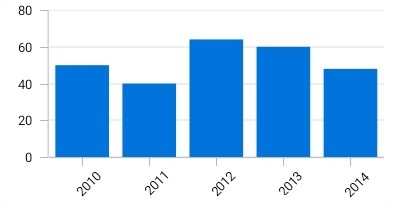
The categorical axis is a nonlinear axis that displays text in axis labels.
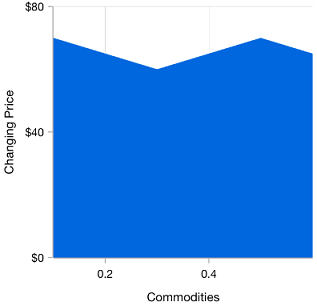
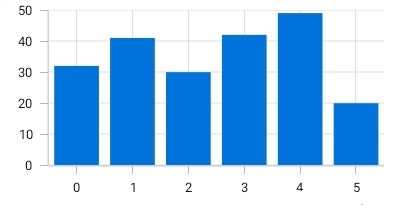
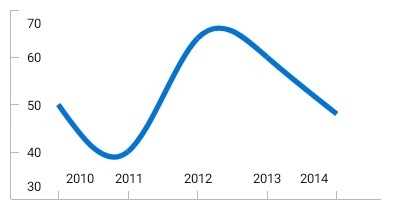
The numerical axis is a linear axis that displays numbers with an equal interval in axis labels.
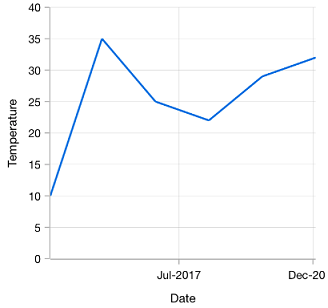
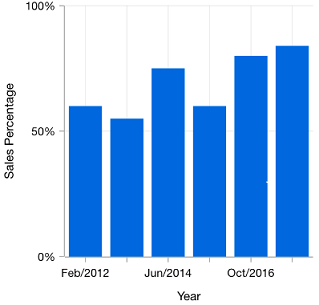
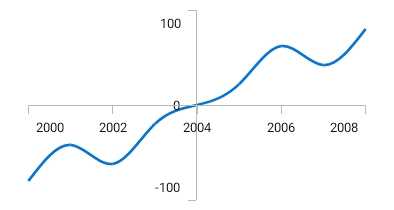
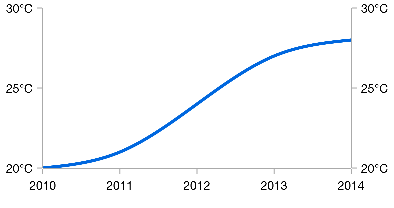
The date-time axis displays date-time values with an equal interval in axis labels. It is typically used as an x-axis.
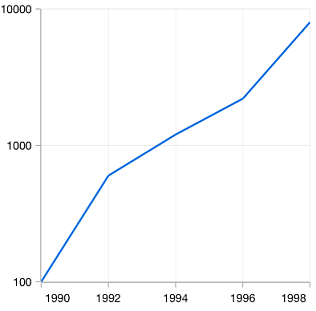
Uses a logarithmic scale and displays numbers in labels.
Nonlinear date-time axis that accepts date-time values and renders data based on its index.
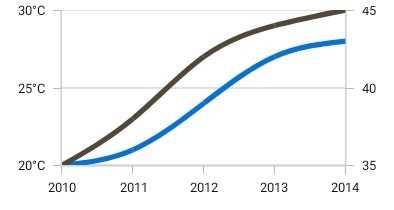
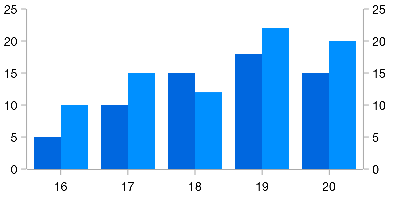
Visualize different units of data with multiple axes, which can be placed at either side of the chart.
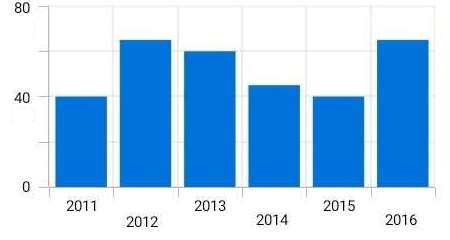
Position axis labels in multiple rows to avoid collision between two labels.
The best possible axis ranges and intervals are calculated automatically based on the given values. The ranges can be further customized with a custom range and range padding.
Place the axis labels and tick lines inside the chart area to reduce the space consumption of an axis, allowing you to plot the data as large as possible.
Rotate the axis labels to place all the labels within the available space.
The position of the axis can be moved anywhere in the chart relative to its associated axis.
When the chart has multiple axes, this feature arranges the axes by moving them to the opposite position from their default position.
Display a duplicate axis on the other side of the original axis to make the chart easily readable when it is rendered in a large monitor or in landscape mode in mobile devices.
 You are using an outdated version of Internet Explorer that may not display all features of this and other websites. Upgrade to Internet Explorer 8 or newer for a better experience.