We use cookies to give you the best experience on our website. If you continue to browse, then you agree to our privacy policy and cookie policy.

The WPF Charts control provides different types of trendlines such as linear, exponential, power, logarithmic, and polynomial. Trendlines are used to analyze and display the trends in the data graphically. It is built on the assumptions based on current and past price trends.
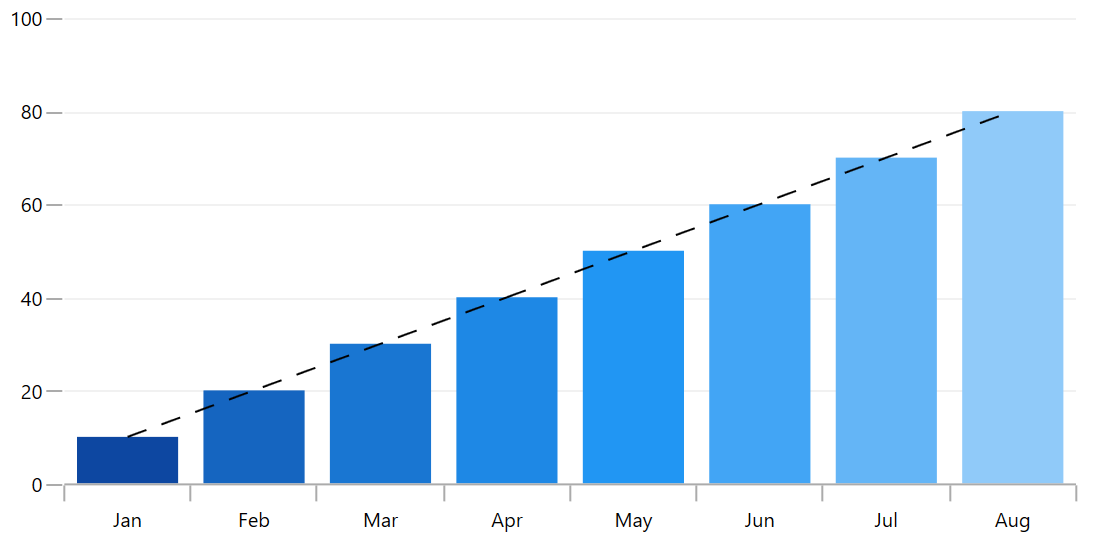
A linear trendline is a straight line that is used with simple linear data sets. It usually shows that something is increasing or decreasing at a steady rate.

The exponential trendline is a curved line that is used when data values rise or fall at increasingly higher rates. If data contains zero or negative values, an exponential trendline cannot be created.
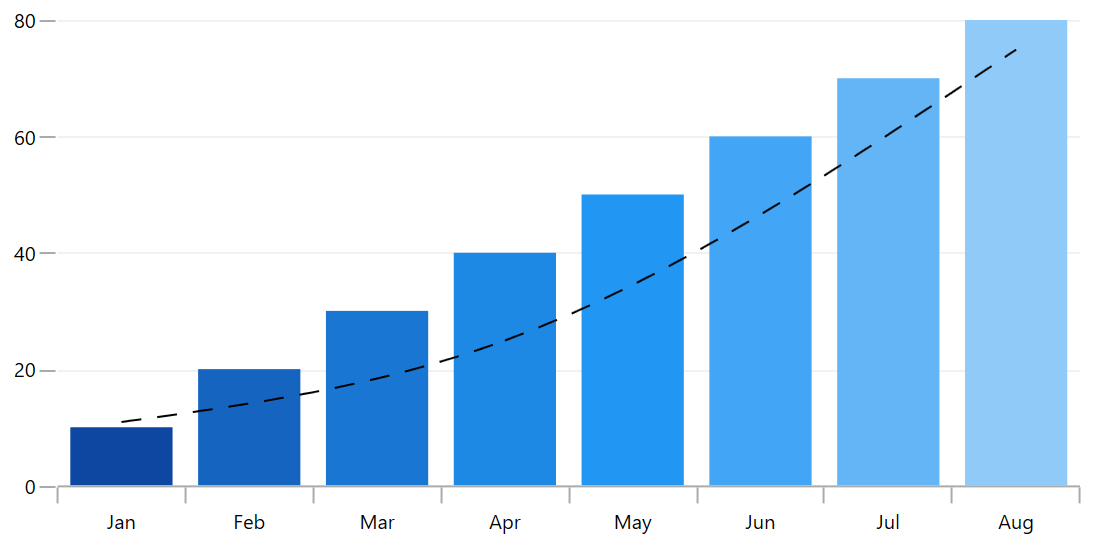
A power trendline is a curved line that is best used with data sets comparing measurements that increase at a specific rate. If data contains zero or negative values, a power trendline cannot be created.

A logarithmic trendline is a curved line that is most useful when the rate of change in the data increases or decreases rapidly and then levels off. It can use negative or positive values.

A polynomial trendline is a curved line that is used when data fluctuates. The polynomial order can be determined by the number of fluctuations in the data or by the number of bends that appear in the curve.
 You are using an outdated version of Internet Explorer that may not display all features of this and other websites. Upgrade to Internet Explorer 8 or newer for a better experience.