We use cookies to give you the best experience on our website. If you continue to browse, then you agree to our privacy policy and cookie policy.

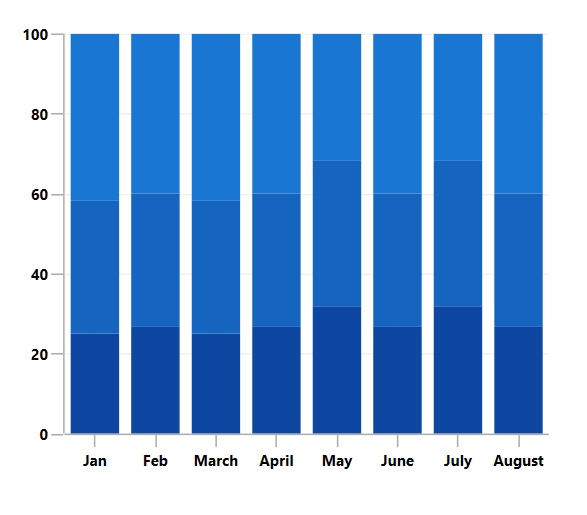
The WPF 100% Stacked Column Chart visualizes data with y-values stacked over one another in the series order. It shows the relationship between individual values to the total sum of the points.
WPF 100 Percentage Stacked Column Chart documentation

Group a series with another series using the group name in a chart. Group the series with different stacking names separately.
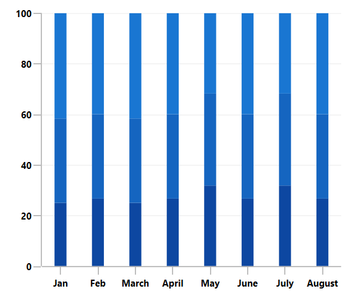
Customize the spacing between two rectangles.
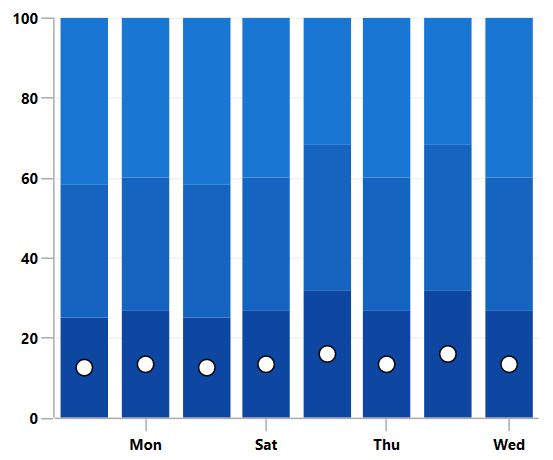
The WPF 100% Stacked Column Chart data points are visualized as marks with the built-in symbols such as cross, square, plus, inverted triangles, hexagon, ellipses, vertical lines, horizontal lines, diamonds, triangles, and pentagons.
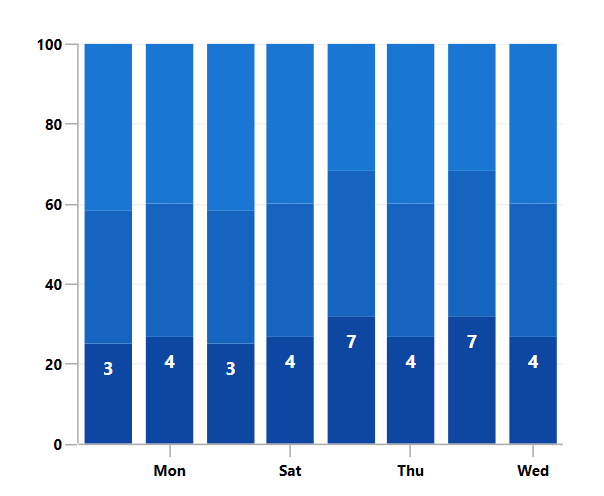
Data labels display information about the data points. It provides the support for customizing the foreground, border, and background in addition to template support to customize the default appearance with the desired view. You can rotate a data label by its given angle.
Easily get started with WPF 100% Stacked Column Chart using a few simple lines of XAML and C# code, as demonstrated below,
<Window x:Class="ChartExample.MainWindow"
        xmlns="http://schemas.microsoft.com/winfx/2006/xaml/presentation"
        xmlns:x="http://schemas.microsoft.com/winfx/2006/xaml"
        xmlns:d="http://schemas.microsoft.com/expression/blend/2008"
        xmlns:mc="http://schemas.openxmlformats.org/markup-compatibility/2006"
        xmlns:local="clr-namespace:ChartExample"
        xmlns:chart="clr-namespace:Syncfusion.UI.Xaml.Charts;assembly=Syncfusion.SfChart.WPF"
        mc:Ignorable="d"
        Title="WPF 100% Stacked Column Chart" Height="450" Width="700">

    <!--Setting DataContext-->
    <Window.DataContext>
        <local:ViewModel/>
    </Window.DataContext>

    <StackPanel>
        <chart:SfChart Height="300" Width="500">
         <!--Initialize the horizontal axis for the WPF Chart-->
            <chart:SfChart.PrimaryAxis>
                <chart:DateTimeAxis LabelFormat="ddd" />
            </chart:SfChart.PrimaryAxis>

            <!--Initialize the vertical axis for the WPF Chart-->
            <chart:SfChart.SecondaryAxis>
                <chart:NumericalAxis />
            </chart:SfChart.SecondaryAxis>

            <!--Adding 100% Stacked Column Series to the WPF Chart-->

            <chart:StackingColumn100Series
                ItemsSource="{Binding Accidents}"
                XBindingPath="Month"
                YBindingPath="Bus">
            </chart:StackingColumn100Series>

            <chart:StackingColumn100Series
                ItemsSource="{Binding Accidents}"
                XBindingPath="Month"
                YBindingPath="Car">
            </chart:StackingColumn100Series>

            <chart:StackingColumn100Series
                ItemsSource="{Binding Accidents}"
                XBindingPath="Month"
                YBindingPath="Truck">
            </chart:StackingColumn100Series>
        </chart:SfChart>
    </StackPanel>
</Window>
public class StackingColumnChartModel
{
public DateTime Month { get; set; }
public double Bus { get; set; }
public double Car { get; set; }
public double Truck { get; set; }
}
public class ViewModel
{
public ObservableCollection<StackingColumnChartModel> Accidents
{
get;
set;
}
public ViewModel()
{
this.Accidents = new ObservableCollection<StackingColumnChartModel>();
DateTime mth = new DateTime(2011, 1, 1);
Accidents.Add(new StackingColumnChartModel() { Month = mth.AddMonths(6), Bus = 3, Car = 4, Truck = 5 });
Accidents.Add(new StackingColumnChartModel() { Month = mth.AddMonths(7), Bus = 4, Car = 5, Truck = 6 });
Accidents.Add(new StackingColumnChartModel() { Month = mth.AddMonths(8), Bus = 3, Car = 4, Truck = 5 });
Accidents.Add(new StackingColumnChartModel() { Month = mth.AddMonths(9), Bus = 4, Car = 5, Truck = 6 });
Accidents.Add(new StackingColumnChartModel() { Month = mth.AddMonths(10), Bus = 7, Car = 8, Truck = 7 });
Accidents.Add(new StackingColumnChartModel() { Month = mth.AddMonths(11), Bus = 4, Car = 5, Truck = 6 });
Accidents.Add(new StackingColumnChartModel() { Month = mth.AddMonths(12), Bus = 7, Car = 8, Truck = 7 });
Accidents.Add(new StackingColumnChartModel() { Month = mth.AddMonths(13), Bus = 4, Car = 5, Truck = 6 });
}
}
Explore the 100% WPF Stacked Column Chart example from GitHub to learn how to render and configure charts.

WPF 100% Stacked Column Chart User Guide
Learn more about the available options to customize WPF 100% Stacked Column Graphs.
 You are using an outdated version of Internet Explorer that may not display all features of this and other websites. Upgrade to Internet Explorer 8 or newer for a better experience.
