We use cookies to give you the best experience on our website. If you continue to browse, then you agree to our privacy policy and cookie policy.

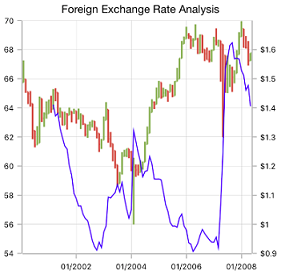
The WPF OHLC Chart is like a candle chart. The horizontal lines at the left and right are used to show opening and closing values of the stock, and the height of the vertical line represents high and low values. They are easily customizable and support interactive features such as trackball, tooltip, selection, and zooming to track information of the data.


Customizable bull and bear colors.

Zoom and pan when dealing with large amounts of data to visualize data point in any region.

Use multiple axes to plot different data sets along two or more axes having different data points and values.
Analyze historical data and predict future price movements using technical indicators.
Easily get started with WPF OHLC Chart using a few simple lines of XAML and C# code, as demonstrated below,
<Window x:Class="ChartExample.MainWindow"
        xmlns="http://schemas.microsoft.com/winfx/2006/xaml/presentation"
        xmlns:x="http://schemas.microsoft.com/winfx/2006/xaml"
        xmlns:d="http://schemas.microsoft.com/expression/blend/2008"
        xmlns:mc="http://schemas.openxmlformats.org/markup-compatibility/2006"
        xmlns:local="clr-namespace:ChartExample"
        xmlns:chart="clr-namespace:Syncfusion.UI.Xaml.Charts;assembly=Syncfusion.SfChart.WPF"
        mc:Ignorable="d"
        Title="WPF Open High Low Close (OHLC) Chart" Height="450" Width="700">

    <!--Setting DataContext-->
    <Window.DataContext>
        <local:ViewModel/>
    </Window.DataContext>

    <StackPanel>
        <chart:SfChart Height="300" Width="500">
            <!--Initialize the horizontal axis for the WPF Chart-->
            <chart:SfChart.PrimaryAxis>
                <chart:DateTimeAxis LabelFormat="ddd" />
            </chart:SfChart.PrimaryAxis>

            <!--Initialize the vertical axis for the WPF Chart-->
            <chart:SfChart.SecondaryAxis>
                <chart:NumericalAxis />
            </chart:SfChart.SecondaryAxis>

            <!--Adding HiLo Open Close Series to the WPF Chart-->
            <chart:HiLoOpenCloseSeries
                Close="Close"
                High="High"
                ItemsSource="{Binding StockPriceDetails}"
                Low="Low"
                Open="Open"
                XBindingPath="Date" >
            </chart:HiLoOpenCloseSeries>
        </chart:SfChart>
    </StackPanel>
</Window>
public class HiLoChartModel
{
public DateTime Date { get; set; }
public double High { get; set; }
public double Low { get; set; }
public double Open { get; set; }
public double Close { get; set; }
}
public class ViewModel
{
public ObservableCollection<HiLoChartModel> StockPriceDetails { get; set; }
public ViewModel()
{
this.StockPriceDetails = new ObservableCollection<HiLoChartModel>();
DateTime date = new DateTime(2012, 1, 1);
this.StockPriceDetails.Add(new HiLoChartModel() { Date = date.AddDays(0), Open = 873.8, High = 878.85, Low = 855.5, Close = 860.5 });
this.StockPriceDetails.Add(new HiLoChartModel() { Date = date.AddDays(1), Open = 873.8, High = 878.85, Low = 855.5, Close = 860.5 });
this.StockPriceDetails.Add(new HiLoChartModel() { Date = date.AddDays(2), Open = 861, High = 868.4, Low = 835.2, Close = 843.45 });
this.StockPriceDetails.Add(new HiLoChartModel() { Date = date.AddDays(3), Open = 846.15, High = 853, Low = 838.5, Close = 847.5 });
this.StockPriceDetails.Add(new HiLoChartModel() { Date = date.AddDays(4), Open = 842, High = 847.75, Low = 827, Close = 832 });
this.StockPriceDetails.Add(new HiLoChartModel() { Date = date.AddDays(5), Open = 841, High = 845, Low = 827.85, Close = 838.65 });
this.StockPriceDetails.Add(new HiLoChartModel() { Date = date.AddDays(6), Open = 846, High = 858.5, Low = 842, Close = 847.75 });
this.StockPriceDetails.Add(new HiLoChartModel() { Date = date.AddDays(7), Open = 865, High = 872, Low = 851, Close = 858.9 });
this.StockPriceDetails.Add(new HiLoChartModel() { Date = date.AddDays(8), Open = 846, High = 860.75, Low = 841, Close = 855 });
this.StockPriceDetails.Add(new HiLoChartModel() { Date = date.AddDays(9), Open = 841, High = 845, Low = 827.85, Close = 838.65 });
}
}
Explore the WPF OHLC Chart example from GitHub to learn how to render and configure charts.
 You are using an outdated version of Internet Explorer that may not display all features of this and other websites. Upgrade to Internet Explorer 8 or newer for a better experience.

