We use cookies to give you the best experience on our website. If you continue to browse, then you agree to our privacy policy and cookie policy.

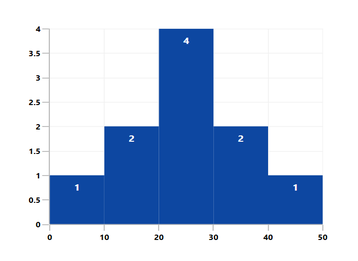
The WPF Histogram Chart plots the distribution of numerical data. Typically, this is by plotting count of objects that fall within certain data ranges. The most common data representation is bars, as a bar can represent the count with its height, and the data range with its position and width.
WPF Histogram Chart documentation


Marks the available data points within the WPF Histogram Chart segment with the built-in symbols such as cross, square, plus, inverted triangles, hexagon, ellipses, vertical lines, horizontal lines, diamonds, triangles, and pentagons.
Data labels display information about the data points. It provides the support for customizing the foreground, border, and background in addition to template support to customize the default appearance with the desired view. You can rotate a data label by its given angle.

Customize the color and border of the WPF Histogram Chart using built-in APIs to make it visually unique.
A graphical representation of the normal distribution of data in the WPF Histogram Chart.
Easily get started with WPF Histogram Chart using a few simple lines of XAML and C# code, as demonstrated below,
<Window x:Class="ChartExample.MainWindow"
        xmlns="http://schemas.microsoft.com/winfx/2006/xaml/presentation"
        xmlns:x="http://schemas.microsoft.com/winfx/2006/xaml"
        xmlns:d="http://schemas.microsoft.com/expression/blend/2008"
        xmlns:mc="http://schemas.openxmlformats.org/markup-compatibility/2006"
        xmlns:local="clr-namespace:ChartExample"
        xmlns:chart="clr-namespace:Syncfusion.UI.Xaml.Charts;assembly=Syncfusion.SfChart.WPF"
        mc:Ignorable="d"
        Title="WPF Histogram Chart" Height="450" Width="700">

    <!--Setting DataContext-->
    <Window.DataContext>
        <local:ViewModel/>
    </Window.DataContext>

    <StackPanel>
        <chart:SfChart Height="300" Width="500">
            <!--Initialize the horizontal axis for the WPF Chart-->
            <chart:SfChart.PrimaryAxis>
                <chart:NumericalAxis />
            </chart:SfChart.PrimaryAxis>

            <!--Initialize the vertical axis for the WPF Chart-->
            <chart:SfChart.SecondaryAxis>
                <chart:NumericalAxis />
            </chart:SfChart.SecondaryAxis>

            <!--Adding HiLo Series to the WPF Chart-->
            <chart:HistogramSeries
                HistogramInterval="10"
                ItemsSource="{Binding Product}"
                XBindingPath="Price"
                YBindingPath="Value">
            </chart:HistogramSeries>
        </chart:SfChart>
    </StackPanel>
</Window>
public class HistogramChartModel
{
public double Price { get; set; }
public double Value { get; set; }
}
public class ViewModel
{
public ObservableCollection<HistogramChartModel> Product { get; set; }
public ViewModel()
{
this.Product = new ObservableCollection<HistogramChartModel>();
Product.Add(new HistogramChartModel() { Price = 1});
Product.Add(new HistogramChartModel() { Price = 11 });
Product.Add(new HistogramChartModel() { Price = 12});
Product.Add(new HistogramChartModel() { Price = 21 });
Product.Add(new HistogramChartModel() { Price = 22});
Product.Add(new HistogramChartModel() { Price = 23});
Product.Add(new HistogramChartModel() { Price = 27 });
Product.Add(new HistogramChartModel() { Price = 33 });
Product.Add(new HistogramChartModel() { Price = 35 });
Product.Add(new HistogramChartModel() { Price = 43 });
}
}
Explore the WPF Histogram Chart example from GitHub to learn how to render and configure charts.

WPF Histogram Chart User Guide
Learn more about the available options to customize WPF Histogram Charts.
 You are using an outdated version of Internet Explorer that may not display all features of this and other websites. Upgrade to Internet Explorer 8 or newer for a better experience.
