We use cookies to give you the best experience on our website. If you continue to browse, then you agree to our privacy policy and cookie policy.

The WPF Column Chart (Vertical Bar Chart) uses vertical bars (called columns) to display different values of one or more items. The column chart is likely the most common chart type. It is like a bar chart except that here the bars are vertical, not horizontal. Points from other series are drawn as columns next to each other. It supports zooming, scrolling, tooltip, trackball, and selection.
WPF Column Chart documentation
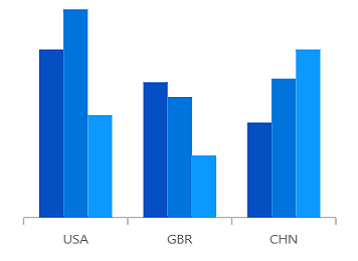

Compare two different types of relational values using WPF Column Charts that overlap one another.
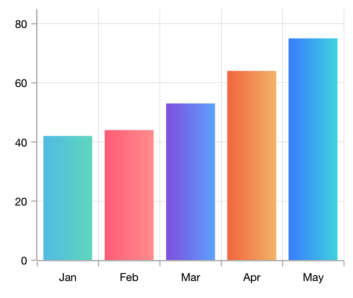
Apply gradient colors to visualize data in different colors, improving the readability and appearance of the WPF Column Chart.
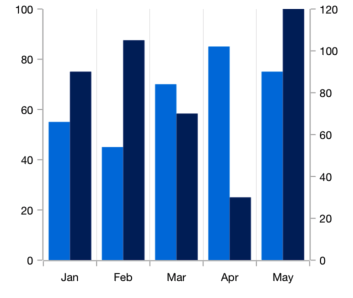
Use multiple axes to plot different data sets along two or more axes having different data points and values.

The WPF Column Chart data points are visualized as marks with the built-in symbols such as cross, square, plus, inverted triangle, hexagon, ellipse, vertical line, horizontal line, diamond, triangle, and pentagon.

Data labels display information about data points. Labels’ foreground, border, and background can be customized. The template support allows customizing the default label appearance with a desired view. You can rotate a data label by a specified angle.
Easily get started with the WPF Column Chart using a few simple lines of C# code example as demonstrated below,
<Window x:Class="ChartExample.MainWindow"
        xmlns="http://schemas.microsoft.com/winfx/2006/xaml/presentation"
        xmlns:x="http://schemas.microsoft.com/winfx/2006/xaml"
        xmlns:d="http://schemas.microsoft.com/expression/blend/2008"
        xmlns:mc="http://schemas.openxmlformats.org/markup-compatibility/2006"
        xmlns:local="clr-namespace:ChartExample"
        xmlns:chart="clr-namespace:Syncfusion.UI.Xaml.Charts;assembly=Syncfusion.SfChart.WPF"
        mc:Ignorable="d"
        Title="WPF Column Chart" Height="450" Width="700">

    <!--Setting DataContext-->
    <Window.DataContext>
        <local:ViewModel/>
    </Window.DataContext>

    <StackPanel>
        <chart:SfChart Height="300" Width="500">
             <!--Initialize the horizontal axis for the WPF Chart-->
            <chart:SfChart.PrimaryAxis>
                <chart:CategoryAxis />
            </chart:SfChart.PrimaryAxis>

            <!--Initialize the vertical axis for the WPF Chart-->
            <chart:SfChart.SecondaryAxis>
                <chart:NumericalAxis />
            </chart:SfChart.SecondaryAxis>

            <!--Adding Column Series to the WPF Chart-->
            <chart:ColumnSeries
                    ItemsSource="{Binding Data}"
                    XBindingPath="Month"
                    YBindingPath="Target">
            </chart:ColumnSeries>
        </chart:SfChart>
    </StackPanel>
</Window>
public class Model
{
public string Month { get; set; }
public double Target { get; set; }
public Model(string xValue, double yValue)
{
Month = xValue;
Target = yValue;
}
}
public class ViewModel
{
public ObservableCollection<Model> Data { get; set; }
public ViewModel()
{
Data = new ObservableCollection<Model>()
{
new Model("Jan", 50),
new Model("Feb", 70),
new Model("Mar", 65),
new Model("Apr", 57),
new Model("May", 48),
};
}
}
 You are using an outdated version of Internet Explorer that may not display all features of this and other websites. Upgrade to Internet Explorer 8 or newer for a better experience.


