We use cookies to give you the best experience on our website. If you continue to browse, then you agree to our privacy policy and cookie policy.

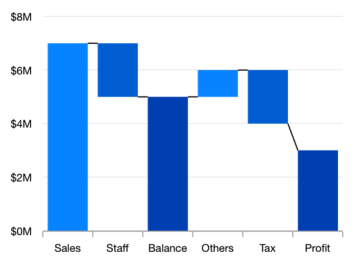
The WPF Waterfall Chart shows gradual changes in the quantitative value of an entity that is subject to change by increments or decrements. So, using the waterfall chart, you can quickly illustrate the changes in revenues.
WPF Waterfall Chart documentation

Calculate the sum of previous data points in the waterfall chart. If this property is disabled, use the specified ItemsSource collection’s y-value.
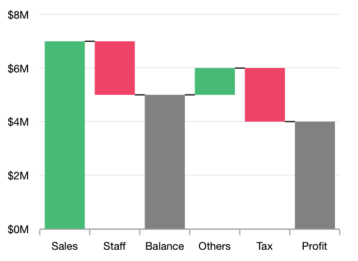
Customize the positive, negative, and summary segment colors of the WPF Waterfall chart by using built-in APIs to make it visually unique.
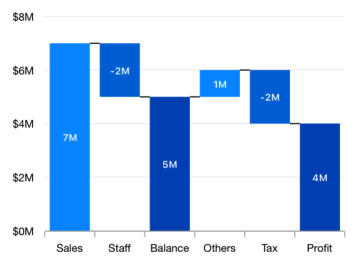
Data labels display information about the data points. It provides the support for customizing the foreground, border, and background in addition to template support to customize the default appearance with the desired view. You can rotate a data label by its given angle.
Easily get started with WPF Waterfall Chart using a few simple lines of XAML and C# code, as demonstrated below,
<Window x:Class="ChartExample.MainWindow"
        xmlns="http://schemas.microsoft.com/winfx/2006/xaml/presentation"
        xmlns:x="http://schemas.microsoft.com/winfx/2006/xaml"
        xmlns:d="http://schemas.microsoft.com/expression/blend/2008"
        xmlns:mc="http://schemas.openxmlformats.org/markup-compatibility/2006"
        xmlns:local="clr-namespace:ChartExample"
        xmlns:chart="clr-namespace:Syncfusion.UI.Xaml.Charts;assembly=Syncfusion.SfChart.WPF"
        mc:Ignorable="d"
        Title="WPF Waterfall Chart" Height="450" Width="700">

    <!--Setting DataContext-->
    <Window.DataContext>
        <local:ViewModel/>
    </Window.DataContext>

    <StackPanel>
        <chart:SfChart Height="300" Width="500">
            <!--Initialize the horizontal axis for the WPF Chart-->
            <chart:SfChart.PrimaryAxis>
                <chart:CategoryAxis />
            </chart:SfChart.PrimaryAxis>

            <!--Initialize the vertical axis for the WPF Chart-->
            <chart:SfChart.SecondaryAxis>
                <chart:NumericalAxis />
            </chart:SfChart.SecondaryAxis>
             <!--Adding Waterfall Series to the WPF Chart-->
            <chart:WaterfallSeries
                ItemsSource="{Binding RevenueDetails}"
                NegativeSegmentBrush="#F14C72"
                SummaryBindingPath="IsSummary"
                SummarySegmentBrush="#8C8C8C"
                XBindingPath="Category"
                YBindingPath="Value">
            </chart:WaterfallSeries>

        </chart:SfChart>
    </StackPanel>
</Window>
public class WaterfallModel
{
public double Value { get; set; }
public string Category { get; set; }
public bool IsSummary { get; set; }
}
public class ViewModel
{
public ViewModel()
{
this.RevenueDetails = new ObservableCollection<WaterfallModel>();
RevenueDetails.Add(new WaterfallModel() { Category = "Sales", Value = 165 });
RevenueDetails.Add(new WaterfallModel() { Category = "Staff", Value = -47 });
RevenueDetails.Add(new WaterfallModel() { Category = "Balance", Value = -58, IsSummary = true });
RevenueDetails.Add(new WaterfallModel() { Category = "Others", Value = 15 });
RevenueDetails.Add(new WaterfallModel() { Category = "Tax", Value = -20 });
RevenueDetails.Add(new WaterfallModel() { Category = " Net Income", Value = 25, IsSummary = true });
}
public ObservableCollection<WaterfallModel> RevenueDetails { get; set; }
}
Explore the WPF Waterfall Chart example from GitHub to learn how to render and configure charts.

WPF Waterfall Chart User Guide
Learn more about the available options to customize WPF Waterfall Charts.
 You are using an outdated version of Internet Explorer that may not display all features of this and other websites. Upgrade to Internet Explorer 8 or newer for a better experience.
