We use cookies to give you the best experience on our website. If you continue to browse, then you agree to our privacy policy and cookie policy.

The WPF Step Line Chart (a.k.a WPF Stepped Chart or WPF Stepped Line Chart) is similar to the line chart, but it does not use the shortest distance to connect two data points using straight lines. Instead, the step line chart uses vertical and horizontal lines to connect data points in a series forming a step-like progression.
WPF StepLine Chart documentation

Rotate the step line chart to plot data vertically and view data from a different perspective.

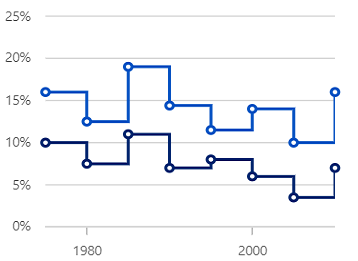
Use multiple axes to plot different data sets along two or more axes having different data points and values.
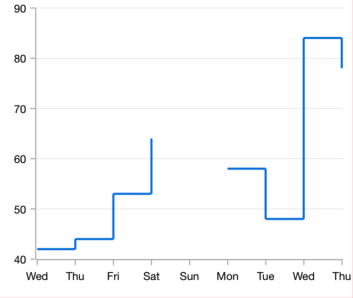
The WPF Step Line Chart handles empty or null data points elegantly.

The WPF Step Line Chart data points are visualized as markers with built-in symbols such as a cross, square, plus, inverted triangle, hexagon, ellipse, vertical line, horizontal line, diamond, triangle, and pentagon.
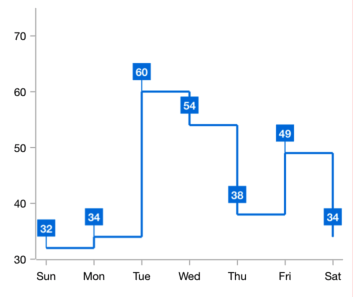
Data labels display information about the data points. It provides the support for customizing the foreground, border, and background in addition to template support to customize the default appearance with the desired view. You can rotate a data label by its given angle.
Easily get started with WPF Step Line Chart using a few simple lines of XAML and C# code, as demonstrated below,
<Window x:Class="ChartExample.MainWindow"
        xmlns="http://schemas.microsoft.com/winfx/2006/xaml/presentation"
        xmlns:x="http://schemas.microsoft.com/winfx/2006/xaml"
        xmlns:d="http://schemas.microsoft.com/expression/blend/2008"
        xmlns:mc="http://schemas.openxmlformats.org/markup-compatibility/2006"
        xmlns:local="clr-namespace:ChartExample"
        xmlns:chart="clr-namespace:Syncfusion.UI.Xaml.Charts;assembly=Syncfusion.SfChart.WPF"
        mc:Ignorable="d"
        Title="WPF Step Line Chart" Height="450" Width="700">

    <!--Setting DataContext-->
    <Window.DataContext>
        <local:ViewModel/>
    </Window.DataContext>

    <StackPanel>
        <chart:SfChart Height="300" Width="500">
            <!--Initialize the horizontal axis for the WPF Chart-->
            <chart:SfChart.PrimaryAxis>
                <chart:CategoryAxis />
            </chart:SfChart.PrimaryAxis>

            <!--Initialize the vertical axis for the WPF Chart-->
            <chart:SfChart.SecondaryAxis>
                <chart:NumericalAxis />
            </chart:SfChart.SecondaryAxis>

            <!--Adding Step Line Series to the WPF Chart-->
            <chart:StepLineSeries
                    ItemsSource="{Binding Data}"
                    XBindingPath="Month"
                    YBindingPath="Target">
            </chart:StepLineSeries>
        </chart:SfChart>
    </StackPanel>
</Window>
public class Model
{
public string Month { get; set; }
public double Target { get; set; }
public Model(string xValue, double yValue)
{
Month = xValue;
Target = yValue;
}
}
public class ViewModel
{
public ObservableCollection<Model> Data { get; set; }
public ViewModel()
{
Data = new ObservableCollection<Model>()
{
new Model("Jan", 50),
new Model("Feb", 70),
new Model("Mar", 65),
new Model("Apr", 57),
new Model("May", 48),
};
}
}
Explore the WPF Step Line Chart example from GitHub to learn how to render and configure charts.

WPF Step Line Chart user guide
Learn more about the available options to customize WPF Step Line Charts.
 You are using an outdated version of Internet Explorer that may not display all features of this and other websites. Upgrade to Internet Explorer 8 or newer for a better experience.
