We use cookies to give you the best experience on our website. If you continue to browse, then you agree to our privacy policy and cookie policy.

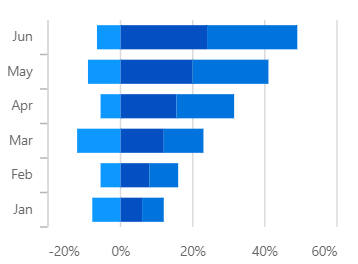
The WPF Stacked Bar Chart visualizes data with y-values stacked over one another in the series order. It shows the relationship between individual values to the total sum of the points.
WPF Stacked Bar Chart documentation

Group a series with another series separately using a different group name.

Customize the spacing between two rectangles.

Customize the color and border of the WPF Stacked Bar chart using built-in APIs to make it visually unique.
Easily get started with WPF Stacked Bar Chart using a few simple lines of XAML and C# code, as demonstrated below,
<Window x:Class="ChartExample.MainWindow"
        xmlns="http://schemas.microsoft.com/winfx/2006/xaml/presentation"
        xmlns:x="http://schemas.microsoft.com/winfx/2006/xaml"
        xmlns:d="http://schemas.microsoft.com/expression/blend/2008"
        xmlns:mc="http://schemas.openxmlformats.org/markup-compatibility/2006"
        xmlns:local="clr-namespace:ChartExample"
        xmlns:chart="clr-namespace:Syncfusion.UI.Xaml.Charts;assembly=Syncfusion.SfChart.WPF"
        mc:Ignorable="d"
        Title="WPF Stacked Bar Chart" Height="450" Width="700">

    <!--Setting DataContext-->
    <Window.DataContext>
        <local:ViewModel/>
    </Window.DataContext>

    <StackPanel>
        <chart:SfChart Height="300" Width="500">
         <!--Initialize the horizontal axis for the WPF Chart-->
            <chart:SfChart.PrimaryAxis>
                <chart:DateTimeAxis LabelFormat="ddd" />
            </chart:SfChart.PrimaryAxis>

            <!--Initialize the vertical axis for the WPF Chart-->
            <chart:SfChart.SecondaryAxis>
                <chart:NumericalAxis />
            </chart:SfChart.SecondaryAxis>

            <!--Adding Stacked BarSeries to the WPF Chart-->

            <chart:StackingBarSeries
                ItemsSource="{Binding Accidents}"
                StrokeThickness="3"
                XBindingPath="Month"
                YBindingPath="Bus">
            </chart:StackingBarSeries>

            <chart:StackingBarSeries
                ItemsSource="{Binding Accidents}"
                StrokeThickness="3"
                XBindingPath="Month"
                YBindingPath="Car">
            </chart:StackingBarSeries>

            <chart:StackingBarSeries
                ItemsSource="{Binding Accidents}"
                StrokeThickness="3"
                XBindingPath="Month"
                YBindingPath="Truck">
            </chart:StackingBarSeries>
        </chart:SfChart>
    </StackPanel>
</Window>
public class StackingBarChartModel
{
public DateTime Month { get; set; }
public double Bus { get; set; }
public double Car { get; set; }
public double Truck { get; set; }
}
public class ViewModel
{
public ObservableCollection<StackingBarChartModel> Accidents
{
get;
set;
}
public ViewModel()
{
this.Accidents = new ObservableCollection<StackingBarChartModel>();
DateTime mth = new DateTime(2011, 1, 1);
Accidents.Add(new StackingBarChartModel() { Month = mth.AddMonths(6), Bus = 3, Car = 4, Truck = 5 });
Accidents.Add(new StackingBarChartModel() { Month = mth.AddMonths(7), Bus = 4, Car = 5, Truck = 6 });
Accidents.Add(new StackingBarChartModel() { Month = mth.AddMonths(8), Bus = 3, Car = 4, Truck = 5 });
Accidents.Add(new StackingBarChartModel() { Month = mth.AddMonths(9), Bus = 4, Car = 5, Truck = 6 });
Accidents.Add(new StackingBarChartModel() { Month = mth.AddMonths(10), Bus = 7, Car = 8, Truck = 7 });
Accidents.Add(new StackingBarChartModel() { Month = mth.AddMonths(11), Bus = 4, Car = 5, Truck = 6 });
Accidents.Add(new StackingBarChartModel() { Month = mth.AddMonths(12), Bus = 7, Car = 8, Truck = 7 });
Accidents.Add(new StackingBarChartModel() { Month = mth.AddMonths(13), Bus = 4, Car = 5, Truck = 6 });
}
}
Explore the WPF Stacked Bar Chart example from GitHub to learn how to render and configure charts.

WPF Stacked Bar Chart User Guide
Learn more about the available options to customize WPF Stacked Bar Charts.
 You are using an outdated version of Internet Explorer that may not display all features of this and other websites. Upgrade to Internet Explorer 8 or newer for a better experience.
