We use cookies to give you the best experience on our website. If you continue to browse, then you agree to our privacy policy and cookie policy.

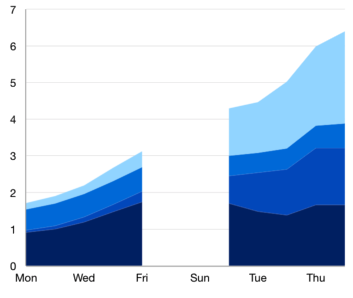
The WPF stacked area chart visualizes data with y-values stacked one over another in series order. It shows the relationship among individual values to the total sum of points.
WPF Stacked Area Chart documentation


Group a series with another series using the group name in a chart. Group the series with different stacking names separately.
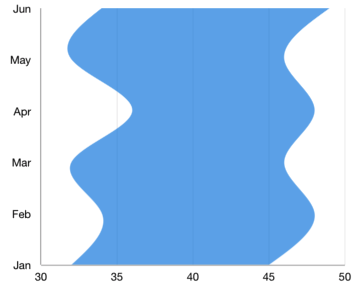
Rotate the WPF stacked area chart to plot data vertically and view it from a different perspective.
Empty or null data points are elegantly handled in the WPF stacked area chart.

Customize the color and border of the chart using the built-in APIs to make it visually unique.
Easily get started with the WPF Stacked Area Chart using a few simple lines of C# code example as demonstrated below,
<Window x:Class="ChartExample.MainWindow"
        xmlns="http://schemas.microsoft.com/winfx/2006/xaml/presentation"
        xmlns:x="http://schemas.microsoft.com/winfx/2006/xaml"
        xmlns:d="http://schemas.microsoft.com/expression/blend/2008"
        xmlns:mc="http://schemas.openxmlformats.org/markup-compatibility/2006"
        xmlns:local="clr-namespace:ChartExample"
        xmlns:chart="clr-namespace:Syncfusion.UI.Xaml.Charts;assembly=Syncfusion.SfChart.WPF"
        mc:Ignorable="d"
        Title="WPF Stacked Area Chart" Height="450" Width="700">

    <!--Setting DataContext-->
    <Window.DataContext>
        <local:ViewModel/>
    </Window.DataContext>

    <StackPanel>
        <chart:SfChart Height="300" Width="500">
         <!--Initialize the horizontal axis for the WPF Chart-->
            <chart:SfChart.PrimaryAxis>
                <chart:DateTimeAxis LabelFormat="ddd" />
            </chart:SfChart.PrimaryAxis>

            <!--Initialize the vertical axis for the WPF Chart-->
            <chart:SfChart.SecondaryAxis>
                <chart:NumericalAxis />
            </chart:SfChart.SecondaryAxis>

            <!--Adding Stacked Area Chart to the WPF Chart-->

            <chart:StackingAreaSeries
                ItemsSource="{Binding Accidents}"
                XBindingPath="Month"
                YBindingPath="Bus">
            </chart:StackingAreaSeries>

            <chart:StackingAreaSeries
                ItemsSource="{Binding Accidents}"
                XBindingPath="Month"
                YBindingPath="Car">
            </chart:StackingAreaSeries>

            <chart:StackingAreaSeries
                ItemsSource="{Binding Accidents}"
                XBindingPath="Month"
                YBindingPath="Truck">
            </chart:StackingAreaSeries>
        </chart:SfChart>
    </StackPanel>
</Window>
public class StackingAreaChartModel
{
public DateTime Month { get; set; }
public double Bus { get; set; }
public double Car { get; set; }
public double Truck { get; set; }
}
public class ViewModel
{
public ObservableCollection<StackingAreaChartModel> Accidents
{
get;
set;
}
public ViewModel()
{
this.Accidents = new ObservableCollection<StackingAreaChartModel>();
DateTime mth = new DateTime(2011, 1, 1);
Accidents.Add(new StackingAreaChartModel() { Month = mth.AddMonths(6), Bus = 3, Car = 4, Truck = 5 });
Accidents.Add(new StackingAreaChartModel() { Month = mth.AddMonths(7), Bus = 4, Car = 5, Truck = 6 });
Accidents.Add(new StackingAreaChartModel() { Month = mth.AddMonths(8), Bus = 3, Car = 4, Truck = 5 });
Accidents.Add(new StackingAreaChartModel() { Month = mth.AddMonths(9), Bus = 4, Car = 5, Truck = 6 });
Accidents.Add(new StackingAreaChartModel() { Month = mth.AddMonths(10), Bus = 7, Car = 8, Truck = 7 });
Accidents.Add(new StackingAreaChartModel() { Month = mth.AddMonths(11), Bus = 4, Car = 5, Truck = 6 });
Accidents.Add(new StackingAreaChartModel() { Month = mth.AddMonths(12), Bus = 7, Car = 8, Truck = 7 });
Accidents.Add(new StackingAreaChartModel() { Month = mth.AddMonths(13), Bus = 4, Car = 5, Truck = 6 });
}
}
WPF Stacked Area Chart User Guide
Learn more about the available options to customize WPF Stacked Area Charts.
 You are using an outdated version of Internet Explorer that may not display all features of this and other websites. Upgrade to Internet Explorer 8 or newer for a better experience.

