We use cookies to give you the best experience on our website. If you continue to browse, then you agree to our privacy policy and cookie policy.

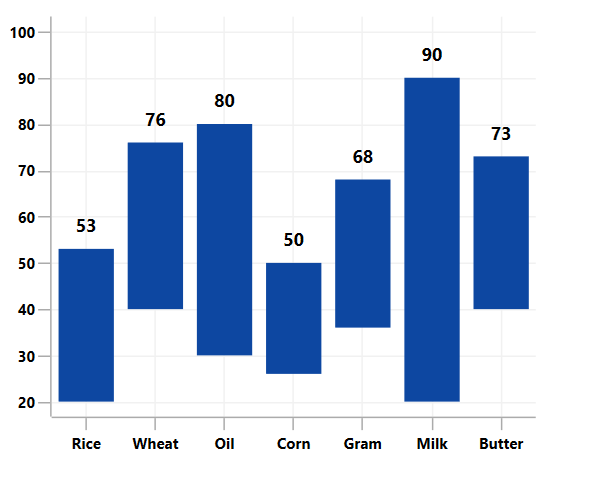
The WPF range column chart is generally used to show the variation in the data value for a given time. It supports zooming, scrolling, tooltip, etc.
WPF Range Column Chart documentation


The WPF range column chart provides an option to customize the spacing between two columns and the width of the column.

Apply gradient colors to visualize data in different colors, improving the readability and appearance of the range column chart in WPF.

The WPF range column chart data points are visualized as marks with built-in symbols: crosses, squares, pluses, inverted triangles, hexagons, ellipses, vertical lines, horizontal lines, diamonds, triangles, and pentagons.
Data labels display information about the data points. You can customize their foreground, border, and background in addition to using template support to customize the default appearance. You can also rotate a data label to a given angle.

The WPF Range Column Chart can be transposed vertically for users to view data from a different perspective.
Easily get started with the WPF Range Column Chart using a few simple lines of C# code example as demonstrated below,
<Window x:Class="ChartExample.MainWindow"
        xmlns="http://schemas.microsoft.com/winfx/2006/xaml/presentation"
        xmlns:x="http://schemas.microsoft.com/winfx/2006/xaml"
        xmlns:d="http://schemas.microsoft.com/expression/blend/2008"
        xmlns:mc="http://schemas.openxmlformats.org/markup-compatibility/2006"
        xmlns:local="clr-namespace:ChartExample"
        xmlns:chart="clr-namespace:Syncfusion.UI.Xaml.Charts;assembly=Syncfusion.SfChart.WPF"
        mc:Ignorable="d"
        Title="WPF Range Column Chart" Height="450" Width="700">

    <!--Setting DataContext-->
    <Window.DataContext>
        <local:ViewModel/>
    </Window.DataContext>

    <StackPanel>
        <chart:SfChart Height="300" Width="500">
            <!--Initialize the horizontal axis for the WPF Chart-->
            <chart:SfChart.PrimaryAxis>
                <chart:CategoryAxis/>
            </chart:SfChart.PrimaryAxis>

            <!--Initialize the vertical axis for the WPF Chart-->
            <chart:SfChart.SecondaryAxis>
                <chart:NumericalAxis/>
            </chart:SfChart.SecondaryAxis>

            <!--Adding Range Column Series to the WPF Chart-->
              <chart:RangeColumnSeries
                High="Stock"
                ItemsSource="{Binding Products}"
                Low="Price"
                XBindingPath="ProductName">
            </chart:RangeColumnSeries>
        </chart:SfChart>
    </StackPanel>
</Window>
public class RangeColumnChartModel
{
public string ProductName { get; set; }
public double Price { get; set; }
public double Stock { get; set; }
}
public class ViewModel
{
public ObservableCollection<RangeColumnChartModel> Products { get; set; }
public ViewModel()
{
this.Products = new ObservableCollection<RangeColumnChartModel>();
Products.Add(new RangeColumnChartModel() { ProductName = "Rice", Price = 20, Stock = 53 });
Products.Add(new RangeColumnChartModel() { ProductName = "Wheat", Price = 22, Stock = 76 });
Products.Add(new RangeColumnChartModel() { ProductName = "Oil", Price = 30, Stock = 80 });
Products.Add(new RangeColumnChartModel() { ProductName = "Corn", Price = 26, Stock = 50 });
Products.Add(new RangeColumnChartModel() { ProductName = "Gram", Price = 36, Stock = 68 });
Products.Add(new RangeColumnChartModel() { ProductName = "Milk", Price = 20, Stock = 90 });
Products.Add(new RangeColumnChartModel() { ProductName = "Butter", Price = 40, Stock = 73 });
}
}
WPF Range Column Chart User Guide
Learn more about the available options to customize WPF Range Column Charts.
 You are using an outdated version of Internet Explorer that may not display all features of this and other websites. Upgrade to Internet Explorer 8 or newer for a better experience.

