We use cookies to give you the best experience on our website. If you continue to browse, then you agree to our privacy policy and cookie policy.


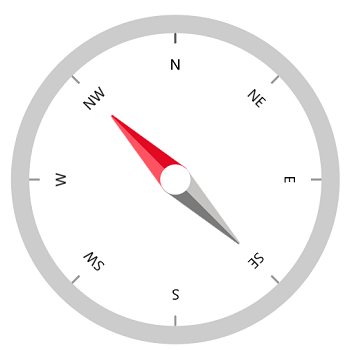
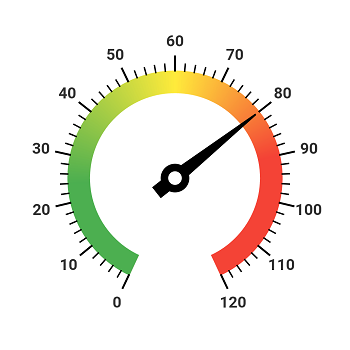
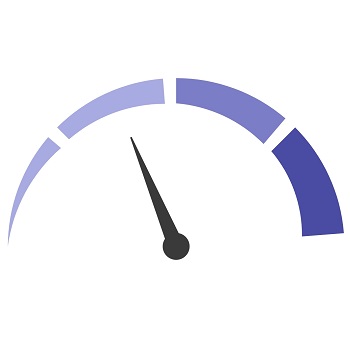
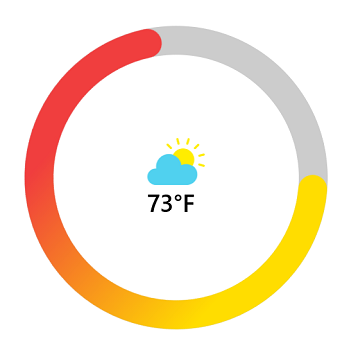
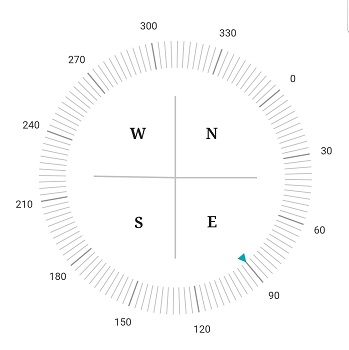
The Radial Gauge control for WinUI is a multi-purpose data visualization control that displays numerical values on a circular scale. It has a rich set of features such as axes, ranges, pointers, and annotations that are fully customizable and extendable. Use it to create speedometers, temperature monitors, dashboards, multi-axis clocks, watches, activity gauges, compasses, and more.
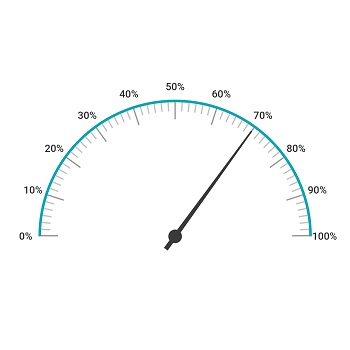
The axis of the WinUI Radial Gauge control is an easily customizable radial arc in which a set of values can be plotted based on business logic.
Customize the look and feel of the default labels using various font-customized properties. You can also add prefix or suffix text to a label.
Define your own style for minor and major ticks with the help of the Stroke and StrokeThickness properties.
To enhance readability, change the default axis position by setting the offset value for labels, ticks, and the axis line.
The axis line is used to add a radial border to a gauge. You can customize the default axis line.
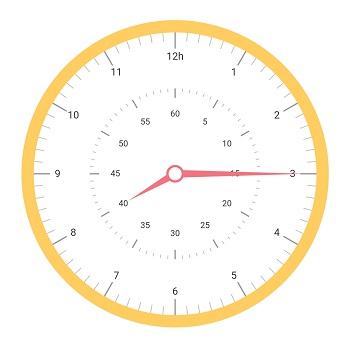
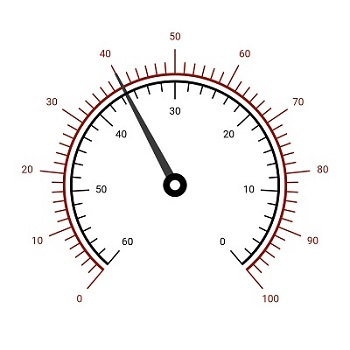
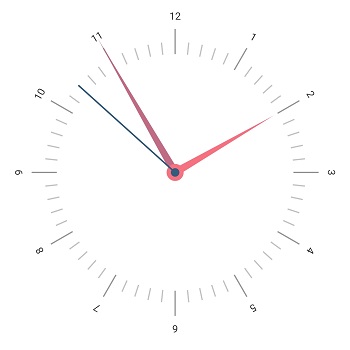
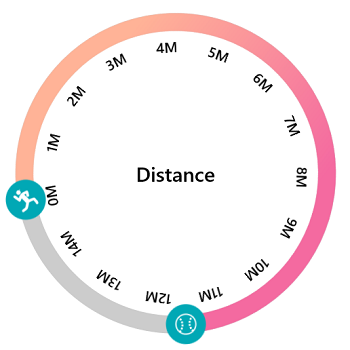
Add multiple axes to the gauge to design it like a clock, dashboard, speedometer, etc.
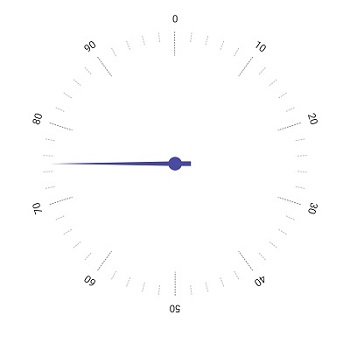
Set the axis direction to clockwise or counterclockwise.
Display a set of values along a linear or custom scale.
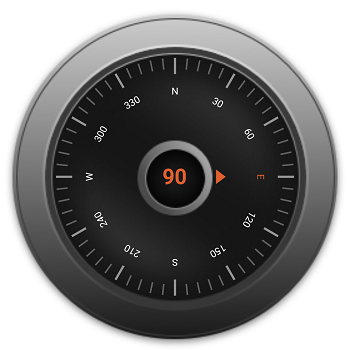
Set the background frame image or any content to a radial axis.
Customize the default look and feel of an axis line’s appearance with a color gradient.
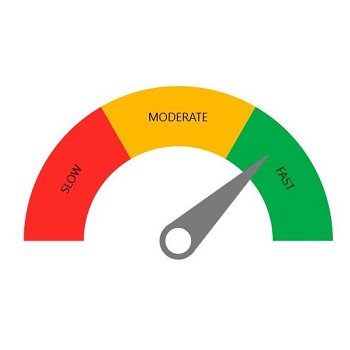
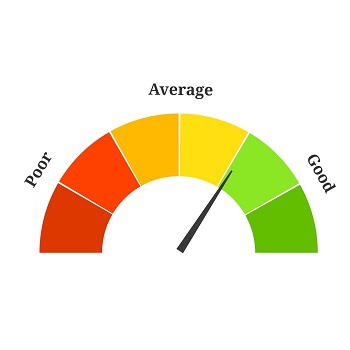
A range of the WinUI Radial Gauge is a visual element that helps you quickly visualize where a value falls on a radial axis.
The range label is used to annotate the text in a range to improve readability.
Change the range position to any place inside the gauge.
The range width varies based on the values to enhance usage and readability.
The WinUI Radial Gauge control allows you to add multiple ranges inside the radial axis to indicate color variation.
You can combine multiple ranges into a single group using the text pointer.
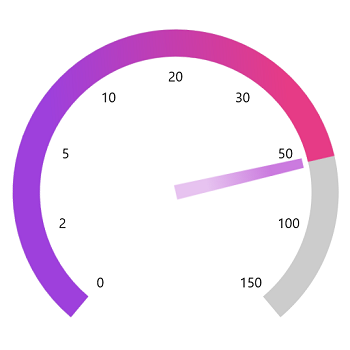
A range of colors can gradually change based on set values to create a smooth color transition.
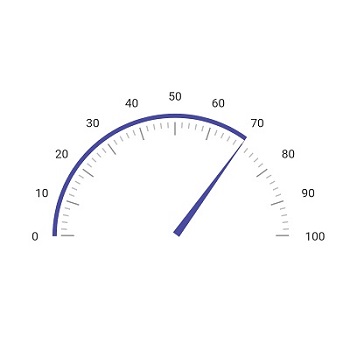
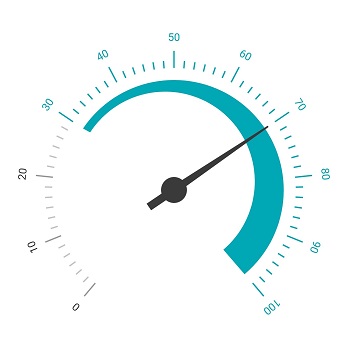
Pointers contains a list of pointer elements, where you can add any number of gauge pointers such as needle pointer, range pointer, and marker pointer inside the axis to indicate a value.
Indicate a current value by using the highly customizable needle-type element.
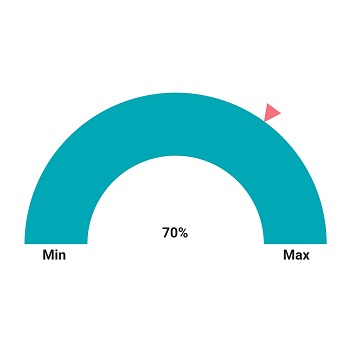
To highlight values, set the marker pointer type to a built-in shape, such as a triangle, inverted triangle, square, or diamond.
To highlight values using an image, set the marker pointer type to image.
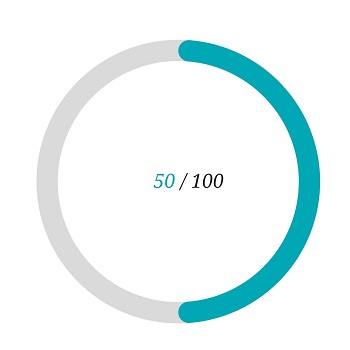
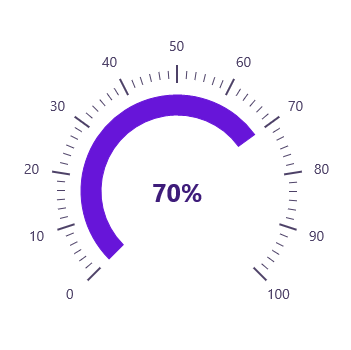
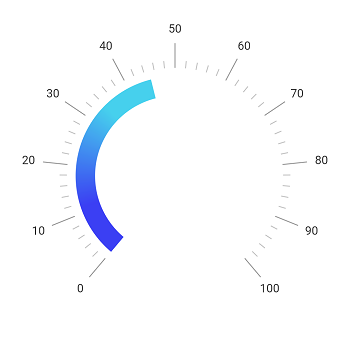
A range pointer is used to indicate the current value relative to the start value of a radial axis.
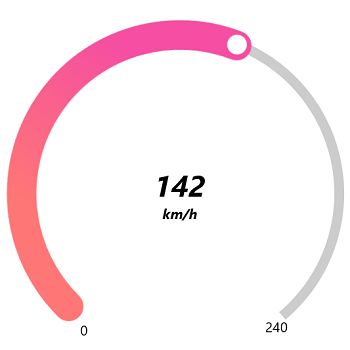
A range of colors can gradually change based on the set values to create a smooth color transition.
Annotations display metadata about a WinUI Radial Gauge at specific points of interest in a plotting area.
The annotations feature provides options to add any image over a gauge control with respect to angle or axis value. You can add multiple images in a single control.
Add any text over the Radial Gauge control to enhance its readability. You can also add multiple text instances in a single control.
The WinUI Radial Gauge control provides visual appeal when the pointer moves from one value to another. Gauge supports various pointer animations.
Drag a pointer from one value to another to change the value at run time.


Greatness—it’s one thing to say you have it, but it means more when others recognize it. Syncfusion is proud to hold the following industry awards.


