We use cookies to give you the best experience on our website. If you continue to browse, then you agree to our privacy policy and cookie policy.


The Linear Gauge control for WinUI is a multipurpose data visualization control that displays numerical values on a linear scale horizontally or vertically. It has a rich set of features, such as ranges and pointers, that are fully customizable and extendable. Use it to create a value indicator, linear progress bar, thermometer, and more.
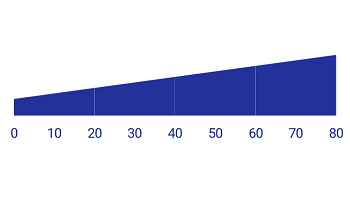
The axis of a WinUI Linear Gauge is a linear scale, where a set of values can be plotted based on business logic. The appearance of an axis can be customized easily. You can change the linear axis orientation to either horizontal or vertical.
Customize the look and feel of the default labels using various font-customized properties. You can also add prefix or suffix text to a label.
Define your own style for minor and major ticks with the help of the Stroke and StrokeThickness properties.

To enhance readability, change the default axis position by setting the offset value for labels and ticks.
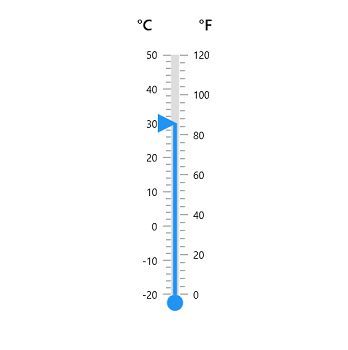
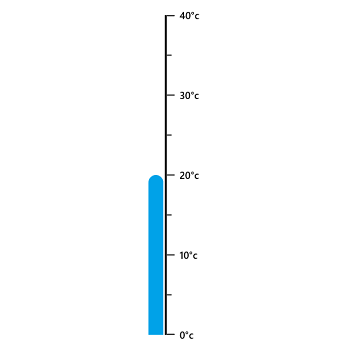
Add multiple axes to the gauge to design it like a thermometer.

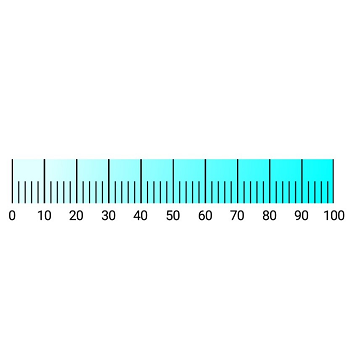
Display a set of values along a linear or custom scale.
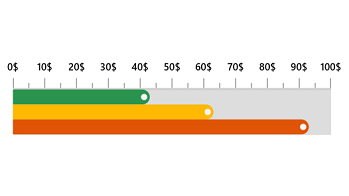
A range is a visual element that helps you quickly visualize where a range falls on the axis track.
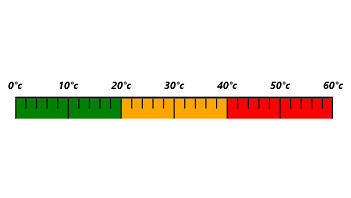
Change the range position to the inside of the axis, the outside of the axis, or crossing the axis.
The range width varies based on the values to enhance usage and readability.

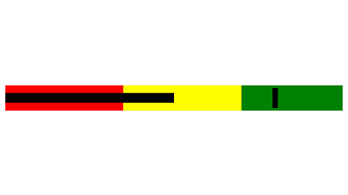
The WinUI Linear Gauge control allows you to add multiple ranges inside the axis to indicate color variation.
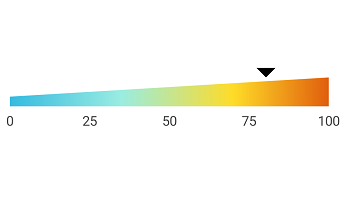
A range of colors can gradually change based on set values to create a smooth color transition.
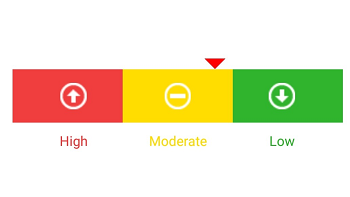
The child content is used to add any content like text or images inside the range to improve readability.
Bar pointers contain a list of pointer elements. You can add any number of bar pointers inside the axis to indicate values. They are used to point out the values from the start value of a linear axis.
Change or move the position of the bar pointer to any place in the gauge.

Add a corner radius at the start, end, and both sides of the bar pointer. This support provides a rich styling experience for data visualization.
Add multiple bar pointers to the axis to show multiple value indications.
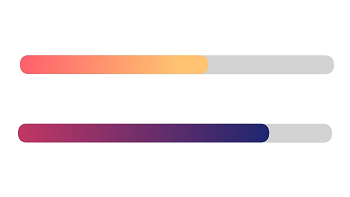
Bar pointer colors change gradually based on scale values, which gives a smooth color transition effect.
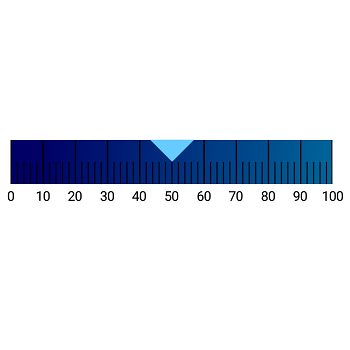
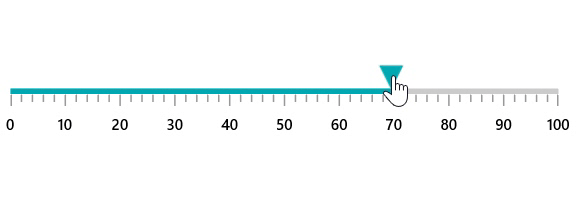
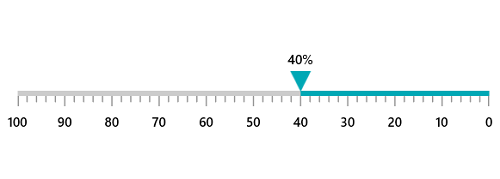
To highlight values, set the marker pointer to a built-in shape type or custom content.
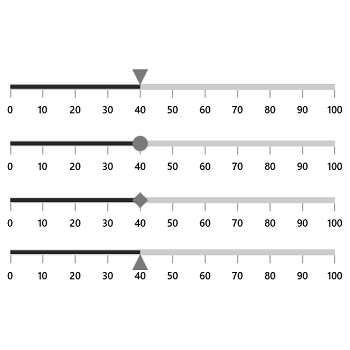
Change the shape pointer type to a built-in shape (triangles, inverted triangles, squares, or diamonds) to highlight the values.
Change or move marker pointers to any place in the gauge.

Highlight values using an image, icon, text, or any other custom view.
The WinUI Linear Gauge control provides visual appeal when the pointer moves from one value to another. Gauge supports various pointer animations.

Drag a pointer from one value to another to change the value at run time.
Right-to-left rendering support is available for users working in RTL languages like Hebrew and Arabic.


Greatness—it’s one thing to say you have it, but it means more when others recognize it. Syncfusion is proud to hold the following industry awards.


