We use cookies to give you the best experience on our website. If you continue to browse, then you agree to our privacy policy and cookie policy.

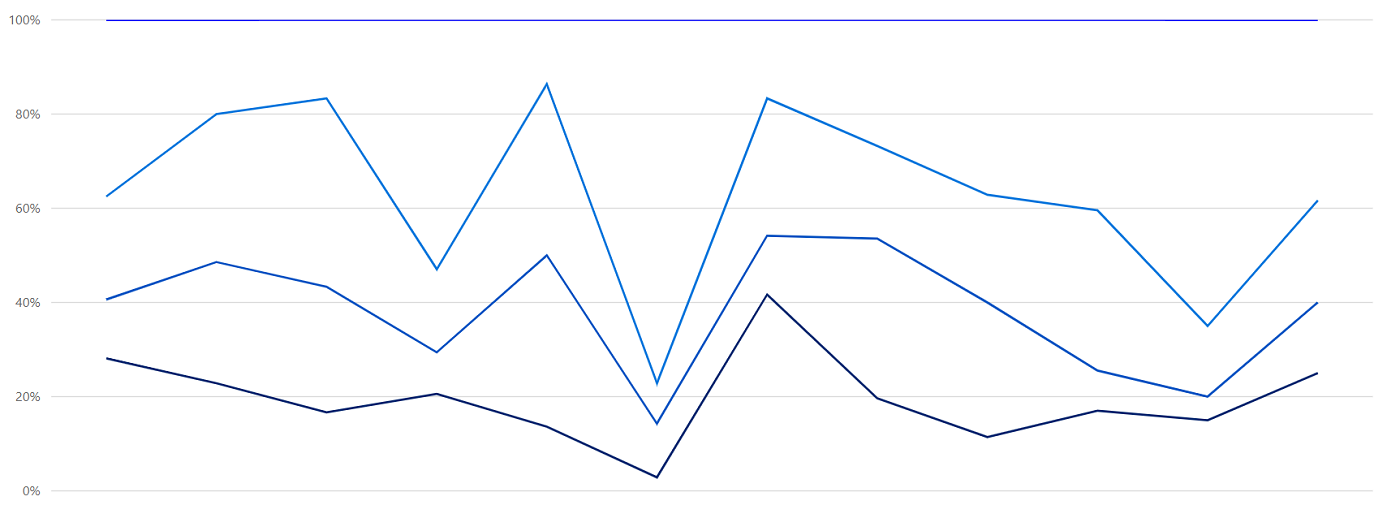
React 100% Stacked Line Chart displays multiple series of data, ensuring that the cumulative proportion of each stacked element always totals 100%. Hence, the y-axis will always be rendered with the range 0–100.
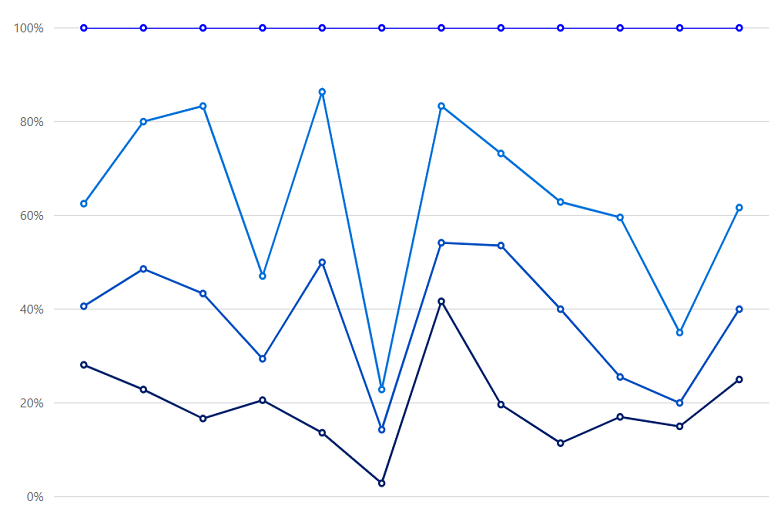
Marks data points with built-in shapes such as circles, rectangles, ellipses, vertical lines, horizontal lines, diamonds, triangles, pentagons, crosses, and pluses. In addition to these shapes, use images to make the point more attractive.
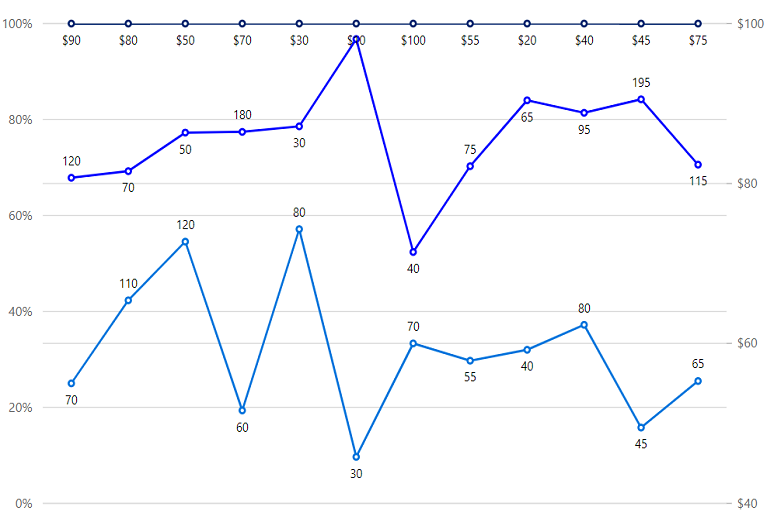
Data labels display information about data points. Add a template to display data labels with HTML elements such as images, DIV, and spans for more informative data labels. You can rotate a data label by its given angle.

Use multiple axes to plot different data sets that widely vary from one other.
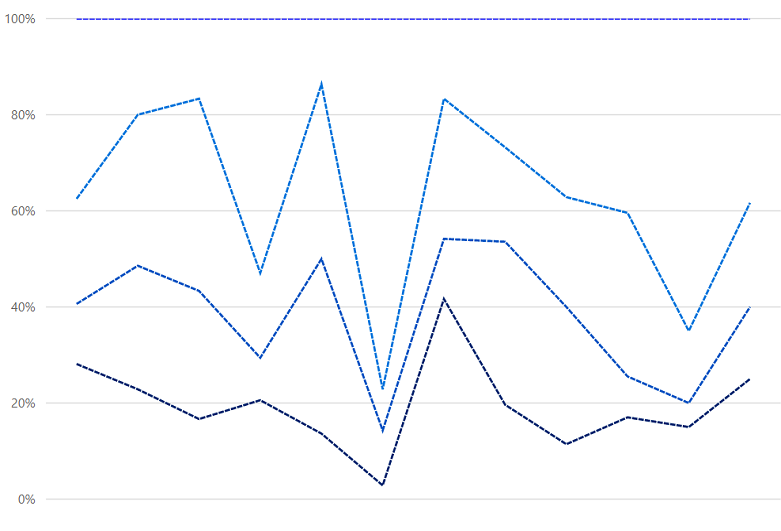
Customize the look and feel of the 100% stacked line chart using built-in APIs.
Easily get started with React 100% stacked line chart using a few simple lines of HTML and JS code example as demonstrated below. Also explore our React 100% Stacked Line Chart Example that shows you how to render and configure the chart.
import { AxisModel, Category, ChartComponent, Inject, SeriesCollectionDirective, SeriesDirective, StackingColumnSeries} from'@syncfusion/ej2-react-charts';
import * as React from 'react';
class App extends React.Component<{}, {}> {
  public primaryXAxis: AxisModel = { valueType: 'Category'};
 let chartData: any[] = [
    { x: 'Food', y: 90, y1: 40, y2: 70, y3: 120 },
    { x: 'Transport', y: 80, y1: 90, y2: 110, y3: 70 },
    { x: 'Medical', y: 50, y1: 80, y2: 120, y3: 50 },
    { x: 'Clothes', y: 70, y1: 30, y2: 60, y3: 180 },
    { x: 'Personal Care', y: 30, y1: 80, y2: 80, y3: 30 },
    { x: 'Books', y: 10, y1: 40, y2: 30, y3: 270 },
    { x: 'Fitness', y: 100, y1: 30, y2: 70, y3: 40 },
    { x: 'Electricity', y: 55, y1: 95, y2: 55, y3: 75 },
    { x: 'Tax', y: 20, y1: 50, y2: 40, y3: 65 },
    { x: 'Pet Care', y: 40, y1: 20, y2: 80, y3: 95 },
    { x: 'Education', y: 45, y1: 15, y2: 45, y3: 195 },
    { x: 'Entertainment', y: 75, y1: 45, y2: 65, y3: 115 }
];
let marker : any[] = {visible: true} ;
public render() {
    return <ChartComponent id='charts'>
      <Inject services={[StackingLineSeries, Category]} />
       <SeriesCollectionDirective>
                            <SeriesDirective dataSource={chartData} xName='x' yName='y' name='John' width='2' type='StackingLine100' marker= {marker} dashArray='5,1'>
                            </SeriesDirective>
                            <SeriesDirective dataSource={chartData} xName='x' yName='y1' name='Peter' width='2' type='StackingLine100' marker= {marker} dashArray='5,1'>
                            </SeriesDirective>
                            <SeriesDirective dataSource={chartData} xName='x' yName='y2' name='Steve' width='2' type='StackingLine100' marker= {marker} dashArray='5,1'>
                            </SeriesDirective>
                            <SeriesDirective dataSource={chartData} xName='x' yName='y3' name='Charle' width='2' type='StackingLine100' marker=  {marker}  dashArray='5,1'>
                            </SeriesDirective>
    </SeriesCollectionDirective>
    </ChartComponent>
  }
};
ReactDOM.render(
  <App />,
  document.getElementById('charts') as HTMLElement
);
<!DOCTYPE html>
<html>
<body>
<div id="charts"></div>
</body>
</html>
100% Stacked Line Chart User Guide
Learn the available options to customize React 100% stacked line chart.
 You are using an outdated version of Internet Explorer that may not display all features of this and other websites. Upgrade to Internet Explorer 8 or newer for a better experience.
