We use cookies to give you the best experience on our website. If you continue to browse, then you agree to our privacy policy and cookie policy.


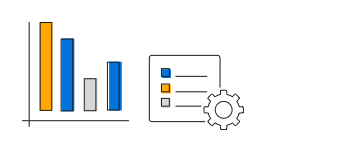
The JSP Pivot Chart control, written in jQuery, organizes and summarizes business data and displays the result in a graphical format.
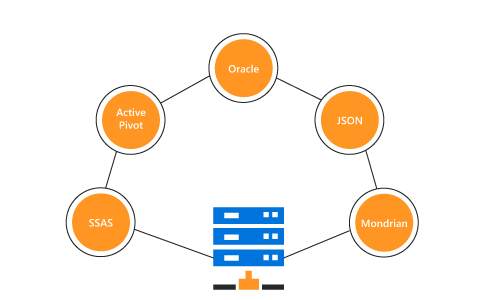
The JSP Pivot Chart provides extensive support to bind OLAP and pivot data sources.

All features work smoothly on desktop and tablet devices. Drill up, drill down, and other chart interactions can be done on the fly.

Responsive support allows the control layout to be viewed on desktop and tablet devices.
End users can easily slice and dice the OLAP cube elements of their choice to visualize performance, trends, outliers, and more.

With slice and dice, you can create a new view for end users by selecting dimensions and measures from the data source OLAP cube and filtering them.

Named sets simplify MDX queries and provide useful aliases for complex, commonly used set expressions.

You can create and display dimensions and measures on your own.
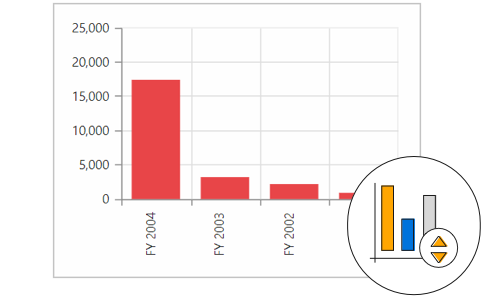
The JSP Pivot Chart supports common chart types: column, stacking column, bar, stacking bar, area, step area, spline area, stacking area, pie, pyramid, line, step line, and spline. Each chart type is easily configurable with built-in support for creating stunning visual effects.


There is built-in support for drilling in (expand) or out (collapse) to visualize the multidimensional and pivot data. Allowing this to be driven by the context menu makes it intuitive to the user.
The multi-level labels, also known as grouping labels, allow you to drill down and drill up to different levels based on the bound data.


Built-in filter options allow users to easily filter and visualize the data in a chart.
Order series based on values. This is applicable only for pivot data sources.
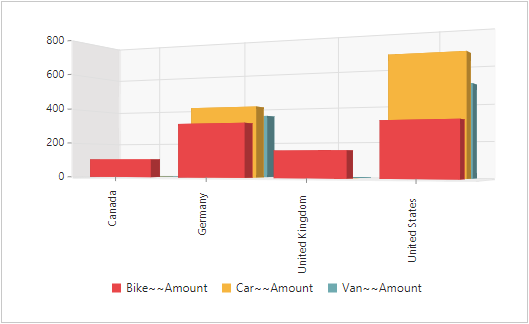
The control offers 3D views for bar charts, column charts, stacking bar charts, stacking column charts, and pie-type charts for stunning visualization.
A color code helps to differentiate among chart series items. A legend has labels beside each color to present some detail about the series.

Customize the series color, border color, and border width of the control.

Data labels provide information about a data point with the help of adornments in series.

Customization options for the axis labels include positioning, placement, label format, and rotation. There are also options for avoiding label overlapping.

An area can be split into multiple panes to draw multiple series with multiple axes.

Chart series can be animated when rendering and refreshing the control.

Titles provide captions for a chart and its axes, describing the control’s actual purpose in an application.
Display metadata about the chart or series at specific points of interest in the plotting area.

Interaction features like zooming, panning, markers, crosshairs, and tooltip are supported for better user experience in the JSP Pivot Chart control.

Marker is a symbolic representation of points in the control. Crosshair will return the exact data for the X and Y coordinates under the pointer.

Users can take a close look at a data point plotted in a series at runtime with the zooming feature.

Users can click and drag the pointer across a zoomed-in chart to navigate to data points for better viewing.

Tooltip provide basic information about a series while the pointer is hovering over it.
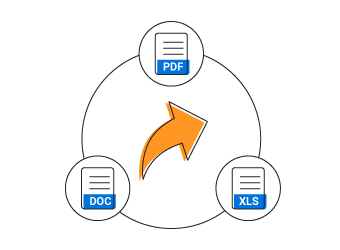
The JSP Pivot Chart control can be exported to a Word, PDF, or Excel document, and image formats like SVG, PNG, and JPEG.

Allows users from different locales to use the control by applying a date format, currency format, and number format that suit local preferences.

Allows users to customize the text in the user interface based on the local culture.

Ships with a set of 13 stunning, built-in themes like azure, lime, and saffron in light, dark, and gradient patterns.

Customize the appearance of the control to any extent.
The JSP Pivot Chart control will work on all major browsers across Windows and macOS. It is written in jQuery to provides the same working experience on popular browser like Chrome 17+, Firefox 22+, and Internet Explorer 8+. It also works with various platforms like ASP.NET Web Forms, ASP.NET MVC, ASP.NET Core, TypeScript and PHP.
The JSP Pivot Chart control has built-in integration with popular third-party frameworks such as Angular, React, Ember, and Aurelia. Check out the control’s unique features for each platform:
Greatness—it’s one thing to say you have it, but it means more when others recognize it. Syncfusion is proud to hold the following industry awards.

