We use cookies to give you the best experience on our website. If you continue to browse, then you agree to our privacy policy and cookie policy.

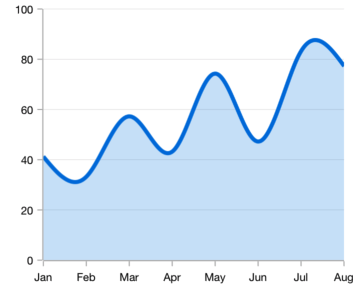
The .NET MAUI spline area chart is designed for visualizing quantitative data. It is an area chart type that plots a fitted curve through each data point in a series. It is used to represent time-dependent data and show trends in data at equal intervals.
.NET MAUI Spline Area Chart documentation

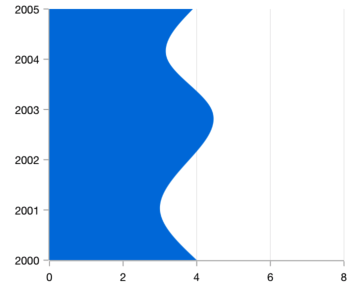
Rotate the spline area chart to plot data vertically and view it from a different perspective.
Customize the color and thickness of the spline area chart using built-in APIs to make it visually unique.
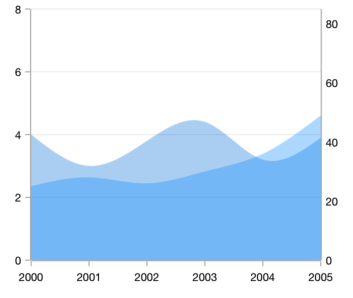
Use multiple axes to plot different data sets that widely vary from one another.
<ContentPage xmlns="http://schemas.microsoft.com/dotnet/2021/maui"
        xmlns:x="http://schemas.microsoft.com/winfx/2009/xaml"
        x:Class="ChartExample.MainPage"
        xmlns:local="using:ChartExample"
        xmlns:chart="clr-namespace:Syncfusion.Maui.Charts;assembly=Syncfusion.Maui.Charts">

    <Grid>
        <chart:SfCartesianChart HorizontalOptions="FillAndExpand" VerticalOptions="FillAndExpand">
            <!--Setting BindingContext-->
            <chart:SfCartesianChart.BindingContext>
                <local:ViewModel/>
            </chart:SfCartesianChart.BindingContext>

            <!--Initialize the horizontal axis for the .NET MAUI Cartesian Chart.-->
            <chart:SfCartesianChart.XAxes>
                <chart:CategoryAxis/>
            </chart:SfCartesianChart.XAxes>

            <!--Initialize the vertical axis for the .NET MAUI Cartesian Chart.-->
            <chart:SfCartesianChart.YAxes>
                <chart:NumericalAxis/>
            </chart:SfCartesianChart.YAxes>

            <!--Adding Spline Area Series to the .NET MAUI Cartesian Chart.-->
            <chart:SplineAreaSeries
                        ItemsSource="{Binding Data}"
                        XBindingPath="Month"
                        YBindingPath="Target">
            </chart:SplineAreaSeries>
        </chart:SfCartesianChart>
    </Grid>
</ContentPage>
public class Model
{
public string Month { get; set; }
public double Target { get; set; }
public Model(string xValue, double yValue)
{
Month = xValue;
Target = yValue;
}
}
public class ViewModel
{
public ObservableCollection<Model> Data { get; set; }
public ViewModel()
{
Data = new ObservableCollection<Model>()
{
new Model("Jan", 50),
new Model("Feb", 70),
new Model("Mar", 65),
new Model("Apr", 57),
new Model("May", 48),
};
}
}
.NET MAUI Spline Area Chart User Guide
Learn more about the available options to customize .NET MAUI spline area charts.
 You are using an outdated version of Internet Explorer that may not display all features of this and other websites. Upgrade to Internet Explorer 8 or newer for a better experience.

