We use cookies to give you the best experience on our website. If you continue to browse, then you agree to our privacy policy and cookie policy.

The .NET MAUI doughnut chart (a.k.a. .NET MAUI donut chart) is a circular graphic ideal for displaying proportional values in different categories. The doughnut chart supports animation and interactive features such as tooltip and selection.
.NET MAUI Doughnut Chart documentation
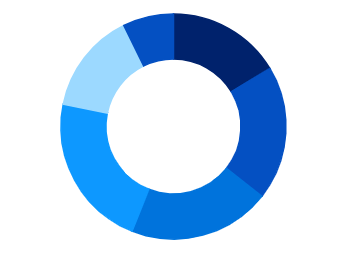
Any view can be added to the center of the doughnut chart.
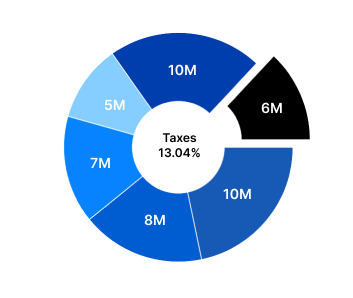
Explode a single segment of the .NET MAUI doughnut chart to differentiate it from others.
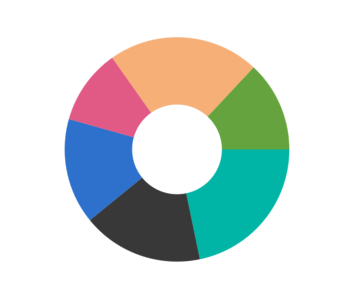
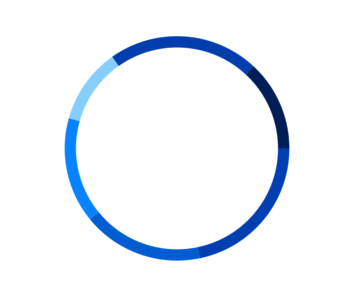
Customize the look and feel of the doughnut using built-in APIs.
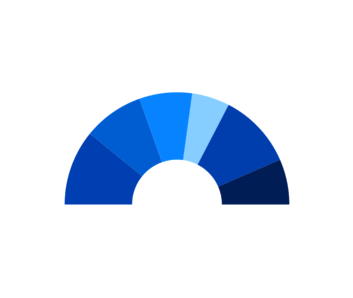
Customize the start angle and end angle of the chart to create a semi-doughnut chart.
Making the inner radius 0 will change the doughnut chart to a pie chart. You can customize both the radius and inner radius of the doughnut.
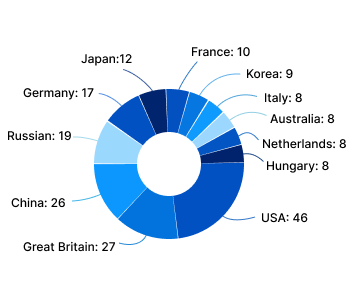
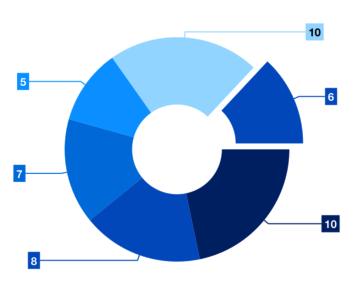
Arrange data labels smartly to avoid overlapping when the data point values are in a close range.
<ContentPage xmlns="http://schemas.microsoft.com/dotnet/2021/maui"
        xmlns:x="http://schemas.microsoft.com/winfx/2009/xaml"
        x:Class="ChartExample.MainPage"
        xmlns:local="using:ChartExample"
        xmlns:chart="clr-namespace:Syncfusion.Maui.Charts;assembly=Syncfusion.Maui.Charts">

    <Grid>
        <chart:SfCircularChart  HorizontalOptions="FillAndExpand" VerticalOptions="FillAndExpand">
            <!--Setting BindingContext-->
            <chart:SfCircularChart.BindingContext>
                <local:ViewModel/>
            </chart:SfCircularChart.BindingContext>

            <!--Adding Doughnut Series to the .NET MAUI Circular Chart.-->
            <chart:DoughnutSeries
                        ItemsSource="{Binding Data}"
                        XBindingPath="Month"
                        YBindingPath="Target">
            </chart:DoughnutSeries>
        </chart:SfCircularChart>
    </Grid>
</ContentPage>
public class Model
{
public string Month { get; set; }
public double Target { get; set; }
public Model(string xValue, double yValue)
{
Month = xValue;
Target = yValue;
}
}
public class ViewModel
{
public ObservableCollection<Model> Data { get; set; }
public ViewModel()
{
Data = new ObservableCollection<Model>()
{
new Model("Jan", 50),
new Model("Feb", 70),
new Model("Mar", 65),
new Model("Apr", 57),
new Model("May", 48),
};
}
}
.NET MAUI Doughnut Chart User Guide
Learn more about the available options to customize .NET MAUI doughnut charts.
 You are using an outdated version of Internet Explorer that may not display all features of this and other websites. Upgrade to Internet Explorer 8 or newer for a better experience.

