We use cookies to give you the best experience on our website. If you continue to browse, then you agree to our privacy policy and cookie policy. Image for the cookie policy date

Color customization for the SPLine curve type

Hi,

I have a spline chart that looks like below. 


The dashed lines represents the range area. I want to change color to RED only for the part of curve that falls out of range. How can I achieve that? 

Here is a sample code:

https://stackblitz.com/edit/angular-ahal33-bwfbbw

1 Reply

BP Baby Palanidurai Syncfusion Team April 11, 2019 12:22 PM UTC

Hi Aparna, 

Greetings from Syncfusion. 

We have analyzed your query. And we can achieved your requirement by using MutiColoredLine series type in series. While using this series type, you can specify the segment axis and segments which you can set the color and values.  

Please find the below code snippet to achieve this requirement, 
Component.ts: 
 
public segments: Object[] = [{ 
        value: 50, 
        color: 'red' 
    }, { 
        value: 80, 
        color: 'green' 
    }, { 
        color: 'red' 
    }]; 

HTML: 

<e-series-collection> 
                <e-series [dataSource]='data' type='MultiColoredLine' xName='y' yName='x' name='Germany' width=2 segmentAxis='Y' [segments]='segments'> </e-series> 
            </e-series-collection> 
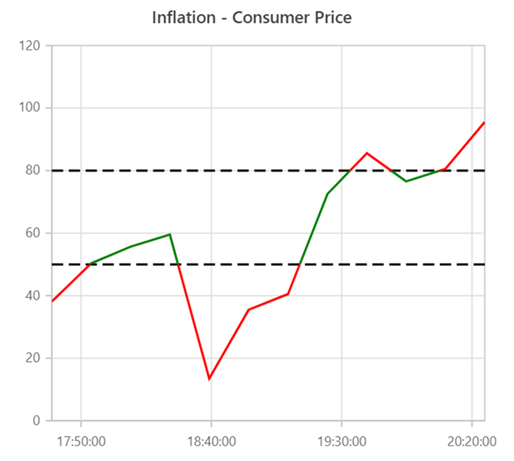
Screenshot: 
 

Kindly revert us, if you have any concerns. 

Regards, 
Baby. 


Loader.
Live Chat Icon For mobile
Up arrow icon