We use cookies to give you the best experience on our website. If you continue to browse, then you agree to our privacy policy and cookie policy. Image for the cookie policy date

DateTimeAxis with intervalType 'Hours' does not work

I'm trying to generate a line chart for a 24hr data but couldn't see the graph in the chart. My data points look like below (printed to console and copied  from i)

public primaryXAxis: Object = {
valueType: 'DateTime',
labelFormat: 'hh:mm',
intervalType: 'Hours',
interval: 4,
majorGridLines: { width: 0 },
minimum: moment().subtract({ hours: 24 }).format(),
maximum: moment.now()
};

//Initializing Primary Y Axis
public primaryYAxis: Object = {
labelFormat: '{value}°F',
rangePadding: 'None',
minimum: 70,
maximum: 100,
interval: 5,
lineStyle: { width: 0 },
majorTickLines: { width: 0 },
minorTickLines: { width: 0 }
};
public chartArea: Object = {
border: {
width: 0
}
};

public width: string = '100%';

public marker: Object = {
visible: true,
height: 10,
width: 10
};

public tooltip: Object = {
enable: true
};

public load(args: ILoadedEventArgs): void {
let selectedTheme: string = location.hash.split('/')[1];
selectedTheme = selectedTheme ? selectedTheme : 'Material';
args.chart.theme = <ChartTheme>(selectedTheme.charAt(0).toUpperCase() + selectedTheme.slice(1)).replace(/-dark/i, "Dark");
};

public title: string = 'Device Data Chart';

<ejs-chart style='display:block; align-items:center' id='chartcontainer' [title]='title' [primaryXAxis]='primaryXAxis' [primaryYAxis]='primaryYAxis'
[tooltip]='tooltip' (load)='load($event)' [chartArea]='chartArea' [width]='width'>
<e-series-collection>
<e-series [dataSource]='chartData' type='Line' xName='x' yName='y' name='Datetime' width=2 [marker]='marker'> </e-series>
</e-series-collection>
</ejs-chart>

3 Replies

KC Kalaimathi Chellaiah Syncfusion Team February 22, 2019 12:51 PM UTC

Hi Aparna, 
 
Greetings from Syncfusion. 
 
We have analyzed your query. We have prepared a sample using attached code snippet. In that snippet you have mentioned x axis value type as DateTime. But in attached data  x contains numeric value and y contains date time value. So kindly bind the xName as y and yName as x in series. Also check the minimum and maximum range in primaryxAxis.  
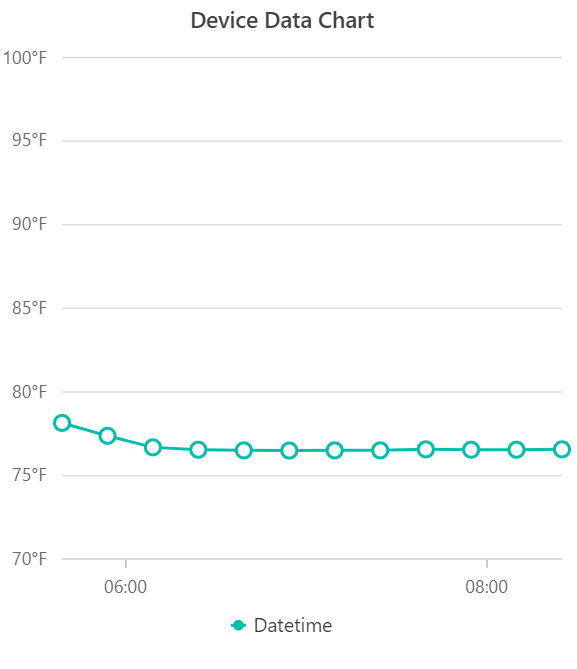
 
 
Screenshot: 
 
Kindly check that above sample and revert us back still issue will be exist. 
 
Regards, 
Kalai. 


AP Aparna Pyla February 22, 2019 05:21 PM UTC

Thank you. It works now. Appreciate your quick response. 


DD Dharanidharan Dharmasivam Syncfusion Team February 25, 2019 04:12 AM UTC

Hi Aparna, 
 
Most welcome. Kindly get in touch with us, if you need further assistance. We are always happy in assisting you. 
 
Thanks, 
Dharani. 


Loader.
Live Chat Icon For mobile
Up arrow icon