We use cookies to give you the best experience on our website. If you continue to browse, then you agree to our privacy policy and cookie policy.


|
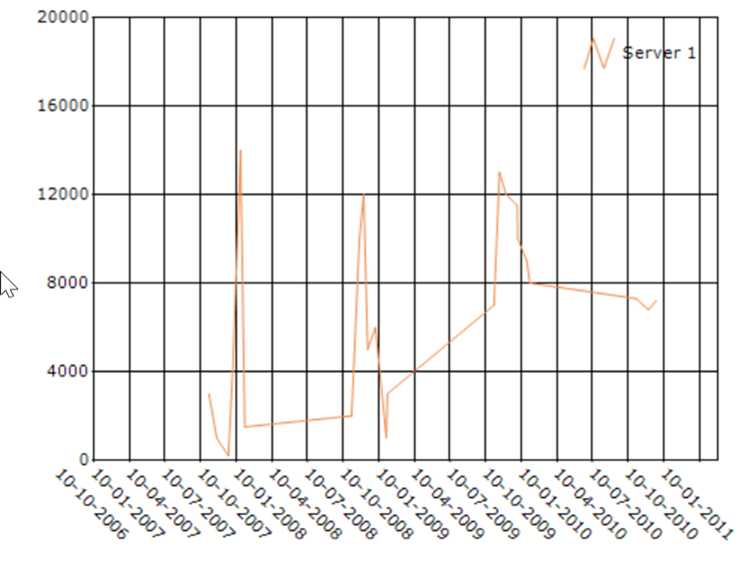
// Date time axis
chart.PrimaryXAxis.DateTimeRange = new ChartDateTimeRange(
new DateTime(2007, 8, 1), // min
new DateTime(2010, 10, 1), // max
5, // interval
ChartDateTimeIntervalType.Months // interval types
);
// Numeric axis
chart.PrimaryYAxis.Range.Interval = 4000; |
|
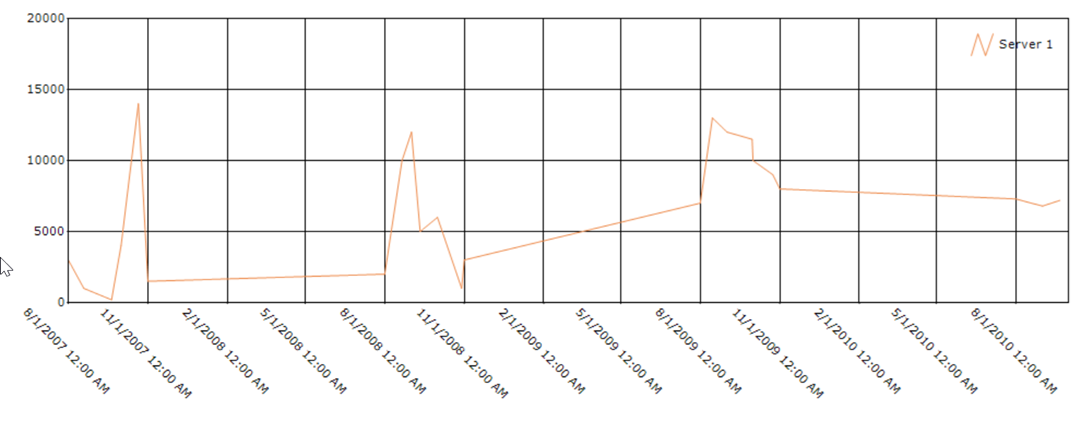
chart.PrimaryXAxis.DateTimeRange = new ChartDateTimeRange(
new DateTime(2007, 8, 1), // min
new DateTime(2010, 10, 1), // max
3, // interval
ChartDateTimeIntervalType.Months // interval types
); |
|
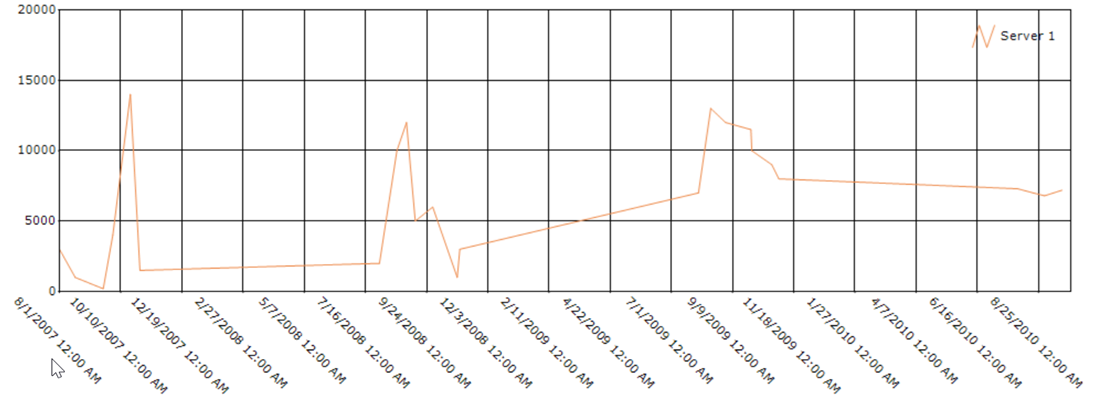
chart.PrimaryXAxis.DateTimeRange = new ChartDateTimeRange(
new DateTime(2007, 8, 1), // min
new DateTime(2010, 10, 1), // max
10, // interval
ChartDateTimeIntervalType.Weeks // interval types
); |


|
chart.PrimaryXAxis.DateTimeRange = new ChartDateTimeRange(
chart.PrimaryXAxis.DateTimeRange.Start, // min
chart.PrimaryXAxis.DateTimeRange.End, // max
3, // interval
ChartDateTimeIntervalType.Months // interval types
); |
|
chart.PrimaryXAxis.DateTimeFormat = "dd-MM-yyyy";
|