We use cookies to give you the best experience on our website. If you continue to browse, then you agree to our privacy policy and cookie policy. Image for the cookie policy date

Conditionally set color of each column & display marker when column is at max

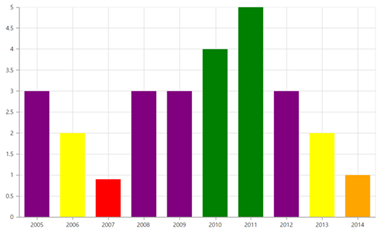
I have the following column chart

 @(Html.EJ().Chart("chart12Container")
              .PrimaryYAxis(pr => pr.Range(ra => ra.Max(5).Min(0).Interval(.5)))
              .PrimaryXAxis(px => px.EnableTrim(true).MaximumLabelWidth(150))
              .CommonSeriesOptions(cr => cr.Type(SeriesType.Column).Marker(mr => mr.DataLabel(dt => dt.Visible(true).TextPosition(TextPosition.Top).Font(fn => fn.Color("black").Size("16px").FontWeight(ChartFontWeight.Bold)))))
              
              .Series(sr =>
              {
                  sr.DataSource(ViewBag.AllAvgChart)
                  .XName("GroupText").YName("AverageAnswer")
                  
                  .Add();
              })
              .Palette(pl => { pl.Add("#008000"); })
              .IsResponsive(true)
              .Legend(lg => lg.Visible(false))

        )

what I need is if the Average Answer is below 1 that it is red in color  and if it is 1-2 it is orange if 2-3 it is yellow and if 3-4 purple  and if 4-5 then green  is that possible?


Also if the Average Answer is 5 I would still like to have the Marker label say 5   right now it will not appear because I have the value set at Top  (at top of column will work too, it does not need to be above the column)

1 Reply

DD Dharanidharan Dharmasivam Syncfusion Team July 12, 2017 06:51 AM UTC

Hi Miranda, 

Thanks for contacting Syncfusion support. 

We have analyzed your query. Find the response for your queries below. 

Queries  
Response 
what I need is if the Average Answer is below 1 that it is red in color  and if it is 1-2 it is orange if 2-3 it is yellow and if 3-4 purple  and if 4-5 then green  is that possible? 
Yes, it is possible as a workaround using the prerender event of chart. In this depends upon the average value(y value), you can specify color to fill property to points as depicted in the below code snippet. 

ASP.NET MVC: 

@(Html.EJ().Chart("chart12Container") 
//... 
              .PreRender("chartPreRender") 
) 

function chartPreRender(sender) { 
        var points = sender.model.series[0].points; 
        for (var i = 0; i < points.length; i++) { 
            var y = points[i].y; 
            if (y < 1) 
                points[i].fill = "red"; 
            else if (y >= 1 && y < 2) 
                points[i].fill = "orange"; 
            else if (y >= 2 && y < 3) 
                points[i].fill = "yellow"; 
            else if (y >= 3 && y < 4) 
                points[i].fill = "purple"; 
            else if (y >= 4 && y <= 5) 
                points[i].fill = "green"; 
        } 
    } 

Screenshot: 


Sample for reference can be find from below link. 

if the Average Answer is 5 I would still like to have the Marker label say 5   right now it will not appear because I have the value set at Top  (at top of column will work too, it does not need to be above the column) 
Since we are not clear with the exact requirement of this query, we suspect that you need to make the data label visible when it moves out of chart. As of now the data label which moves out of chart area will get clipped, this is the default behavior. But this can be overcome in following ways. 

Solution 1: 

You can specify the range (max) as 6 in your sample, so that the data label will be visible. Find the code snippet below to achieve this requirement. 

 
@(Html.EJ().Chart("chart12Container") 
  //... 
  .PrimaryYAxis(pr => pr.Range(ra => ra.Max(6)) ) 
) 


Solution 2: 

You can specify the rangePadding property as additional to y axis, so that the data label will be visible. But you need specify either rangePadding property or range to y axis, if you specify the both then range will be considered. Find the code snippet below to achieve this requirement. 


@(Html.EJ().Chart("chart12Container") 
  //... 
  .PrimaryYAxis(pr => pr.RangePadding(ChartRangePadding.Additional)) 
) 


Solution 3: 

You can also specify the plotoffset property of y axis as depicted in the below code snippet, so that the offset will be added to the top and bottom of y axis. 


@(Html.EJ().Chart("chart12Container") 
  //... 
  .PrimaryYAxis(pr => pr.PlotOffset(24)) 
) 


Screenshot: 
 
Kindly revert us with more information on your query, if we have misunderstood it. So that we can analyze and provide you the solution sooner. 


Thanks, 
Dharani. 


Loader.
Live Chat Icon For mobile
Up arrow icon