We use cookies to give you the best experience on our website. If you continue to browse, then you agree to our privacy policy and cookie policy.

|
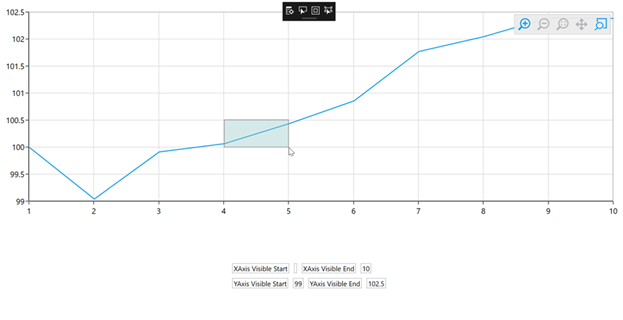
<chart:SfChart Name="chart" ZoomChanged="chart_ZoomChanged">
<chart:SfChart.PrimaryAxis>
<chart:CategoryAxis
ActualRangeChanged="CategoryAxis_ActualRangeChanged" />
</chart:SfChart.PrimaryAxis>
<chart:SfChart.SecondaryAxis>
<chart:NumericalAxis
ActualRangeChanged="NumericalAxis_ActualRangeChanged"/>
</chart:SfChart.SecondaryAxis>
<chart:SfChart.Behaviors>
<chart:ChartZoomPanBehavior EnableSelectionZooming="True"
EnablePanning="True"
EnableZoomingToolBar="True"
ToolBarItems="All"/>
</chart:SfChart.Behaviors>
</chart:SfChart>
|
|
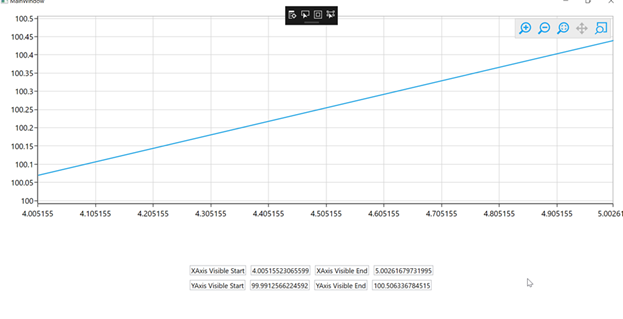
private void CategoryAxis_ActualRangeChanged(object sender,
ActualRangeChangedEventArgs e)
{
yStart.Text = chart.SecondaryAxis.VisibleRange.Start.ToString();
yEnd.Text = chart.SecondaryAxis.VisibleRange.End.ToString();
}
private void NumericalAxis_ActualRangeChanged(object sender,
ActualRangeChangedEventArgs e)
{
xStart.Text = chart.PrimaryAxis.VisibleRange.Start.ToString();
xEnd.Text = chart.PrimaryAxis.VisibleRange.End.ToString();
} |


|
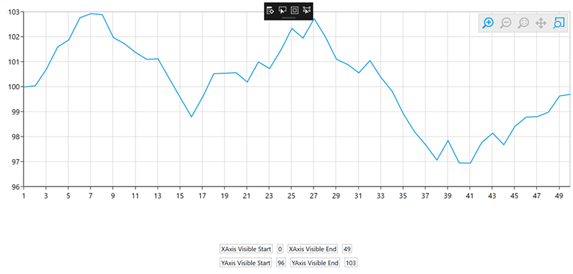
<chart:SfChart Name="chart" >
<chart:SfChart.PrimaryAxis>
<chart:NumericalAxis x:Name="xAxis"
EdgeLabelsVisibilityMode="AlwaysVisible"
Interval="1"
ActualRangeChanged="xAxis_ActualRangeChanged"/>
</chart:SfChart.PrimaryAxis>
<chart:SfChart.SecondaryAxis>
<chart:NumericalAxis x:Name="yAxis"
ActualRangeChanged="yAxis_ActualRangeChanged"/>
</chart:SfChart.SecondaryAxis>
</chart:SfChart>
|
|
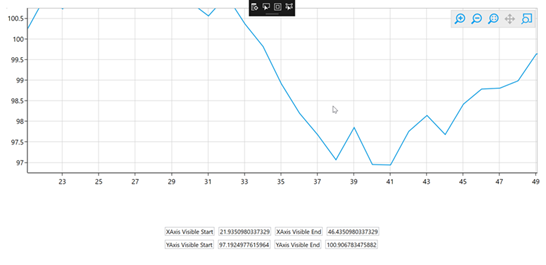
private void xAxis_ActualRangeChanged(object sender,
Syncfusion.UI.Xaml.Charts.ActualRangeChangedEventArgs e)
{
yStart.Text = chart.SecondaryAxis.VisibleRange.Start.ToString();
yEnd.Text = chart.SecondaryAxis.VisibleRange.End.ToString();
}
private void yAxis_ActualRangeChanged(object sender,
Syncfusion.UI.Xaml.Charts.ActualRangeChangedEventArgs e)
{
xStart.Text = chart.PrimaryAxis.VisibleRange.Start.ToString();
xEnd.Text = chart.PrimaryAxis.VisibleRange.End.ToString();
} |