We use cookies to give you the best experience on our website. If you continue to browse, then you agree to our privacy policy and cookie policy. Image for the cookie policy date
close icon

Export to excel of Chart is don't work.

Hi,
I want to export the data chart, but it don't work.
I'm implemented in accordance with Example.
Please teach me what is bad,
also let me know if there is an example to other.

* Export Chart Example

-------------------------------------------------------------------------------
  View
-------------------------------------------------------------------------------
<button onclick="download()">down load</button>
<div id="chart"></div>

<script>
$(function ($) {
    $("#chart").ejChart({
        "exportSettings": {
            "action": "ExportChart",
            "mode"  : "server",
            "type"  : "xlsx"
        }
    });
});
function download() {
    $("#chart").ejChart("export");
}
</script>

-------------------------------------------------------------------------------
  Controller
-------------------------------------------------------------------------------
public void ExportChart(string Data, string ChartModel)
{
    ChartProperties obj = ConvertChartObject(ChartModel);
    string type         = obj.ExportSettings.Type.ToString().ToLower();
    string fileName     = obj.ExportSettings.FileName;
    string orientation  = obj.ExportSettings.Orientation.ToString();
    
    List<KeyValuePair<string, object>> chartData = new List<KeyValuePair<string, object>>();
    chartData.Add(new KeyValuePair<string, object>("John", 10));
    chartData.Add(new KeyValuePair<string, object>("Jake", 20));

    ExcelExport exp = new ExcelExport();
    exp.Export(obj, (IEnumerable<KeyValuePair<string, object>>)chartData, fileName + ".xlsx", ExcelVersion.Excel2010, null, null);
}

private ChartProperties ConvertChartObject(string ChartModel)
{
    JavaScriptSerializer serializer = new JavaScriptSerializer();
    IEnumerable<KeyValuePair<string, object>> div = (IEnumerable<KeyValuePair<string, object>>)serializer.Deserialize(ChartModel, typeof(IEnumerable<KeyValuePair<string, object>>));
    ChartProperties chartProp = new ChartProperties();
    foreach (KeyValuePair<string, object> ds in div)
    {
        var property = chartProp.GetType().GetProperty(ds.Key, BindingFlags.Instance | BindingFlags.Public | BindingFlags.IgnoreCase);
        if (property != null)
        {
            Type type = property.PropertyType;
            string serialize = serializer.Serialize(ds.Value);
            object value = serializer.Deserialize(serialize, type);
            property.SetValue(chartProp, value, null);
        }
    }
    return chartProp;
}

4 Replies

DD Dharanidharan Dharmasivam Syncfusion Team November 9, 2016 01:13 PM UTC

Hi Yuta, 

Thanks for using Syncfusion product. 

We have analyzed your query. In chart, you have to specify the property  for x and y values for the series in the given data. So that chart will get export. Find the code snippet below, 
 
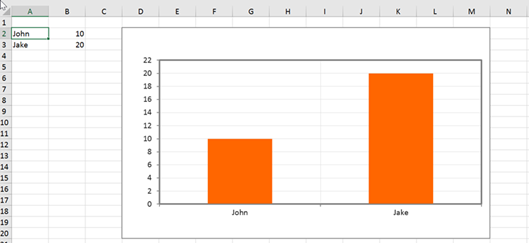
ASP.NET MVC: 

//Creating dataSource in codeBehind 
public ActionResult Index() 
        { 
            List<KeyValuePair> chartData = new List<KeyValuePair>(); 
            chartData.Add(new KeyValuePair("John", 10)); 
            chartData.Add(new KeyValuePair("Jake", 20)); 
            ViewBag.data = chartData; 
            
            return View(); 
        } 


@(Html.EJ().Chart("container") 
//... 
//Binding dataSource to chart 
.Series(sr=>sr. 
          XName("X").YName("Y").DataSource(@ViewBag.data) 
            
          .Add()) 
) 
 
//Function to download chart 
function download() { 
    var chart = $("#container").ejChart("instance"); 
    chart.model.exportSettings.fileName = "Chart";      
    chart.model.exportSettings.action = "/Home/ExportChart"; 
    chart.model.exportSettings.type = "xlsx"; 
    chart.model.exportSettings.mode = "server";      
    chart.export(); 
     
} 
  

Screenshot: 
 

For your reference we have attached the sample. Kindly find the sample from below location. 
  
Thanks, 
Dharani. 


YU Yuta November 10, 2016 01:12 AM UTC

Hello,

Thank you for the advice and sample.
As of advice, It working by adding the following modifications.
Thank you so very much. :D

1)  Changing the "x" and "y" to upper case.
2)  Adding a property of "xNameand "yName".

-------------------------------------------------------------------------------
  Before
-------------------------------------------------------------------------------
.........
series: [
    {
        name:"",
        points:[
            { x: 1, y: 2 },
            { x: 3, y: 4 },
            { x: 5, y: 6 },
            { x: 7, y: 8 }
]
    }
]
.........

-------------------------------------------------------------------------------
  After
-------------------------------------------------------------------------------
.........
series: [
    {
        name:"",
        points:[
            { X: 1, Y: 2 },
            { X: 3, Y: 4 },
            { X: 5, Y: 6 },
            { X: 7, Y: 8 }
],
    xName: "X",
    yName: "Y"
    }
]
.........


YU Yuta November 10, 2016 02:05 AM UTC

Sorry, The following was unnecessary.

1)  
Changing the "x" and "y" to upper case.


DD Dharanidharan Dharmasivam Syncfusion Team November 10, 2016 09:13 AM UTC

Hi Yuta, 
 
Thanks for your update. 
 
Kindly revert us, if you need further assistance. 

Thanks, 
Dharani. 


Loader.
Live Chat Icon For mobile
Up arrow icon