We use cookies to give you the best experience on our website. If you continue to browse, then you agree to our privacy policy and cookie policy.

The Flutter Pie Chart is a circular graphic, which is ideal for displaying proportional values in different categories. You can create beautiful, animated, real-time and high-performance pie chart that also supports the interactive features such as explode, tooltip and selection.


Explode a slice in the pie chart to differentiate it from other slices.
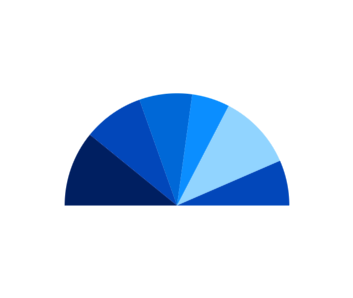
Configure the semi pie to visualize data in a different perspective and reduce the size of the rendering area.
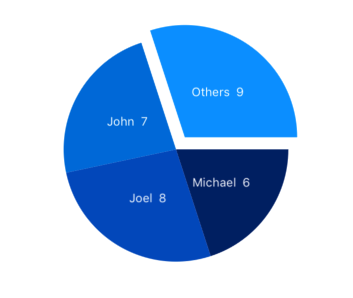
Group smaller segments in the Flutter Pie Chart to a single segment called “others”.

Customize the look and feel of the Flutter Pie Chart using built-in APIs.

Arranges data labels smartly to avoid overlapping when the data point values fall in close range.
Easily get started with the Flutter Pie Chart using a few simple lines of DART code example as demonstrated below,
import 'package:flutter/material.dart';
import 'package:syncfusion_flutter_charts/charts.dart';

@override
    Widget build(BuildContext context) {
        final List<ChartData> chartData = [
            ChartData('David', 25),
            ChartData('Steve', 38),
            ChartData('Jack', 34),
            ChartData('Others', 52)
        ];
        return Scaffold(
            body: Center(
                child: Container(
                    child: SfCircularChart(
                        series: <CircularSeries>[
                            // Render pie chart
                            PieSeries<ChartData, String>(
                                dataSource: chartData,
                                pointColorMapper:(ChartData data, _) => data.color,
                                xValueMapper: (ChartData data, _) => data.x,
                                yValueMapper: (ChartData data, _) => data.y
                            )
                        ]
                    )
                )
            )
        );
    }

    class ChartData {
        ChartData(this.x, this.y, [this.color]);
        final String x;
        final double y;
        final Color? color;
    }
 You are using an outdated version of Internet Explorer that may not display all features of this and other websites. Upgrade to Internet Explorer 8 or newer for a better experience.


