Welcome to the Blazor feedback portal. We’re happy you’re here! If you have feedback on how to improve the Blazor, we’d love to hear it!
Thanks for joining our community and helping improve Syncfusion products!
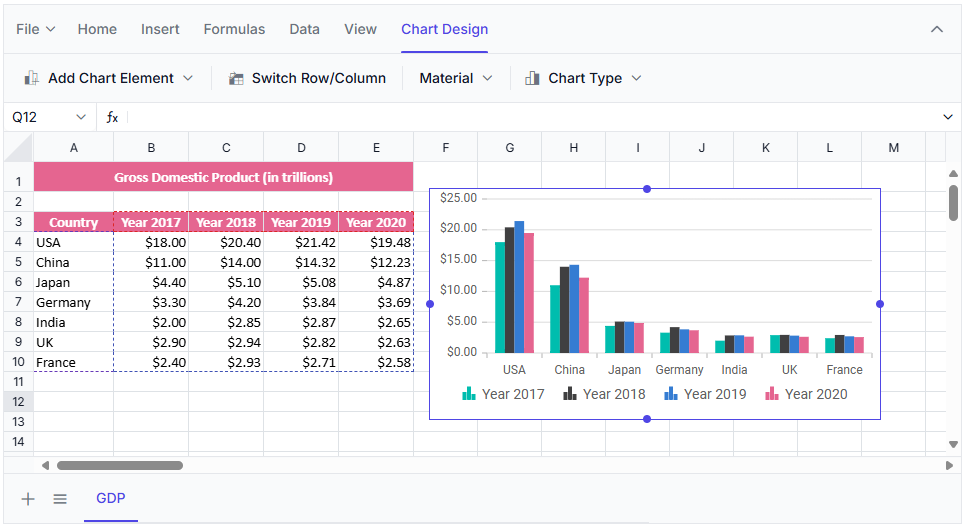
Need to provide support for creating and displaying charts within the Spreadsheet component. This enhancement would allow users to visually represent data using a variety of chart types.
Currently, the Spreadsheet component supports data manipulation through cell formatting and formulas but lacks built-in charting capabilities. Adding chart support would enable users to generate chart types such as Column, Bar, Area, Line, Pie, and Scatter.
Support for these chart types would significantly enhance the component’s ability to visualize complex datasets and trends, making it more suitable for business, educational, and analytical use cases.
 Bold BI
 Bold Reports
 BoldDesk