Welcome to the ASP.NET Core feedback portal. We’re happy you’re here! If you have feedback on how to improve the ASP.NET Core, we’d love to hear it!
Check out the features or bugs others have reported and vote on your favorites. Feedback will be prioritized based on popularity.
If you have feedback that’s not listed yet, submit your own.
Thanks for joining our community and helping improve Syncfusion products!
1
Vote
Support for Sankey chart in the EJ2
Nishanthi Panner Selvam
Created On
:Jan 20, 2025 7:22 AM
Updated On
:Jan 20, 2025 10:03 PM
Type
:Feature Request
Control
:Chart
Nishanthi Panner Selvam
Created On
:
Jan 20, 2025 7:22 AM
Type
:
Feature Request
Control
:
Chart
Updated On
:
Jan 20, 2025 10:03 PM
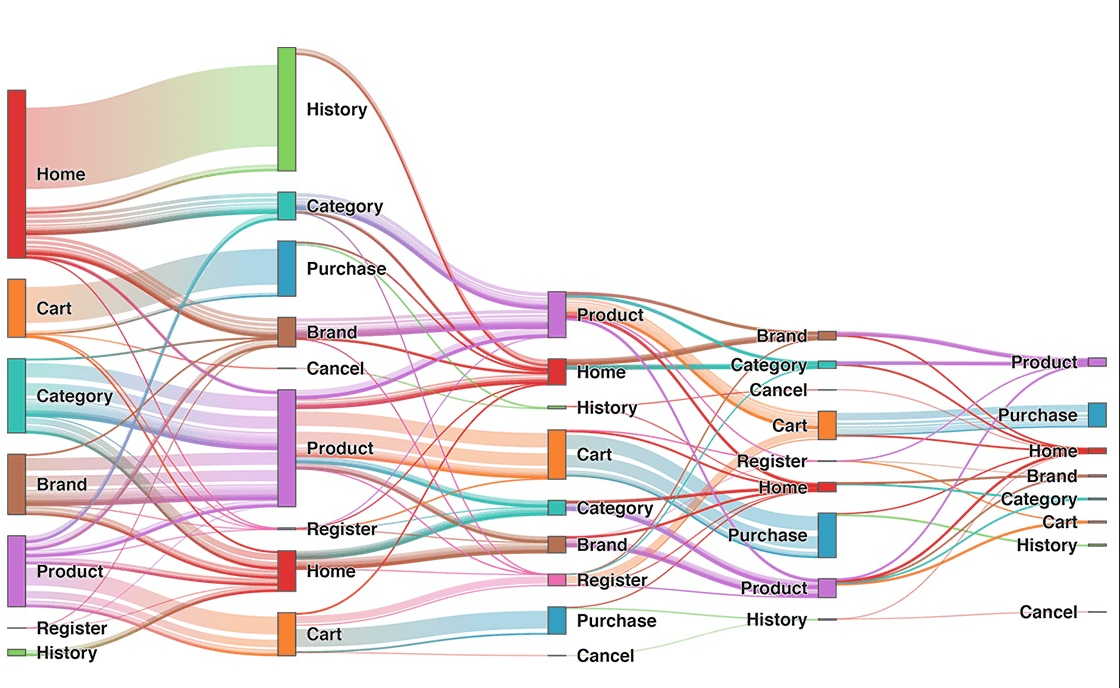
A Sankey chart is a type of flow diagram that visualizes the flow of resources or entities between multiple nodes. It is particularly useful for illustrating the flow of materials, energy, or money between various stages in a process or system. As of now, we do not have support for this type of chart. So, need to provide support for Sankey chart. Please find the below image for your reference.
 Bold BI
 Bold Reports
 BoldDesk