Welcome to the Angular feedback portal. We’re happy you’re here! If you have feedback on how to improve the Angular, we’d love to hear it!
Thanks for joining our community and helping improve Syncfusion products!
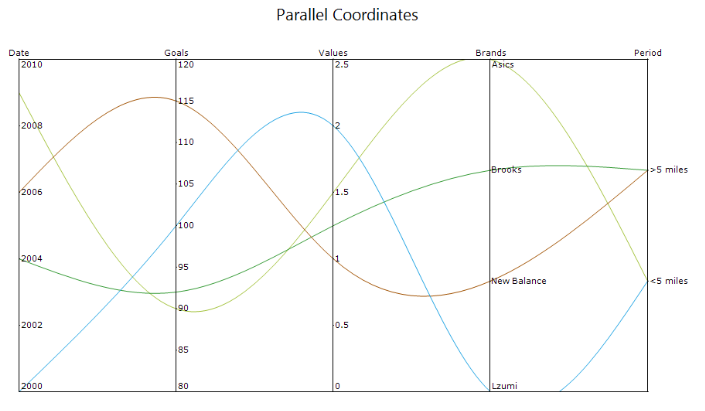
Parallel Coordinate chart - A parallel coordinate chart is a graphical method where each data point is represented as a line traversing a series of parallel axes, each corresponding to a specific variable or dimension. It is particularly useful for visualizing high-dimensional datasets.
Need to provide support for the parallel coordinate chart in EJ2.
 Bold BI
 Bold Reports
 BoldDesk