Welcome to the React feedback portal. We’re happy you’re here! If you have feedback on how to improve the React, we’d love to hear it!
Thanks for joining our community and helping improve Syncfusion products!
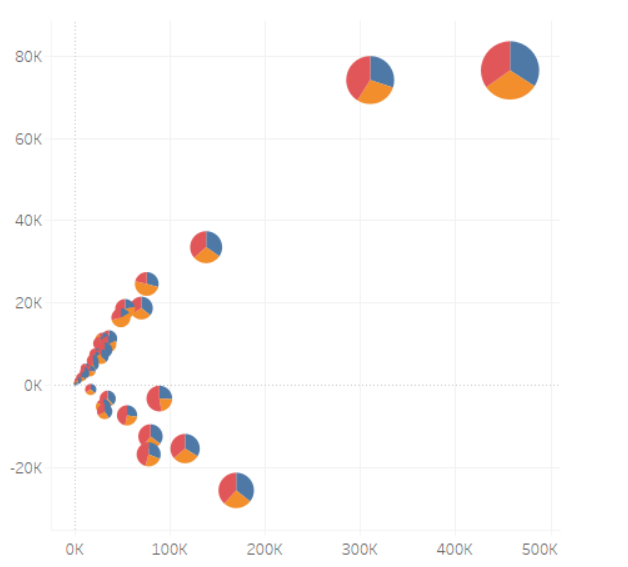
Need to create a pie chart that will serve as a custom marker in a scatter chart, where each data point is represented by a pie chart.
 Bold BI
 Bold Reports
 BoldDesk