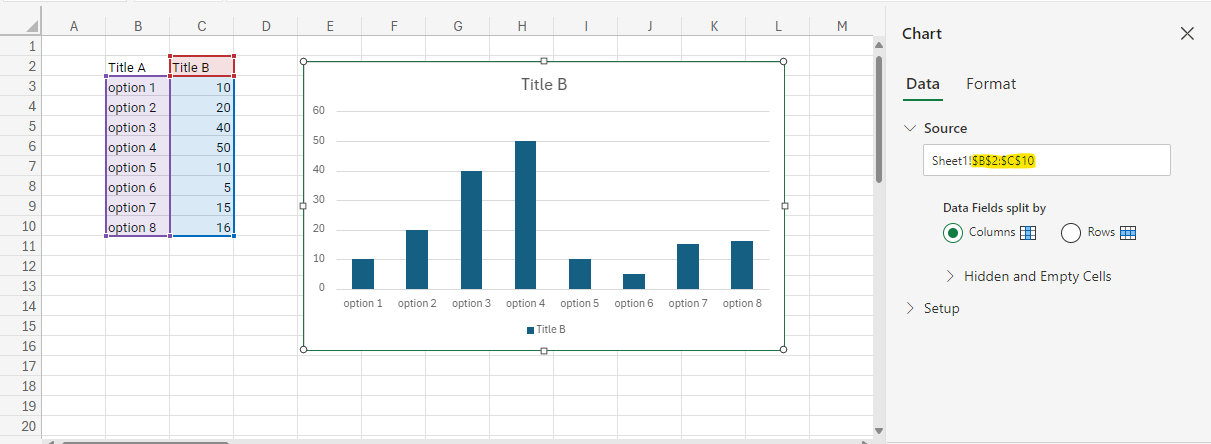
When inserting or deleting rows within or above the chart's data range, or columns within or to the left of the chart's data range, we need to update the chart's data ranges similarly to how MS Excel does.
Note: The position of chart elements needs to be handled during these actions.
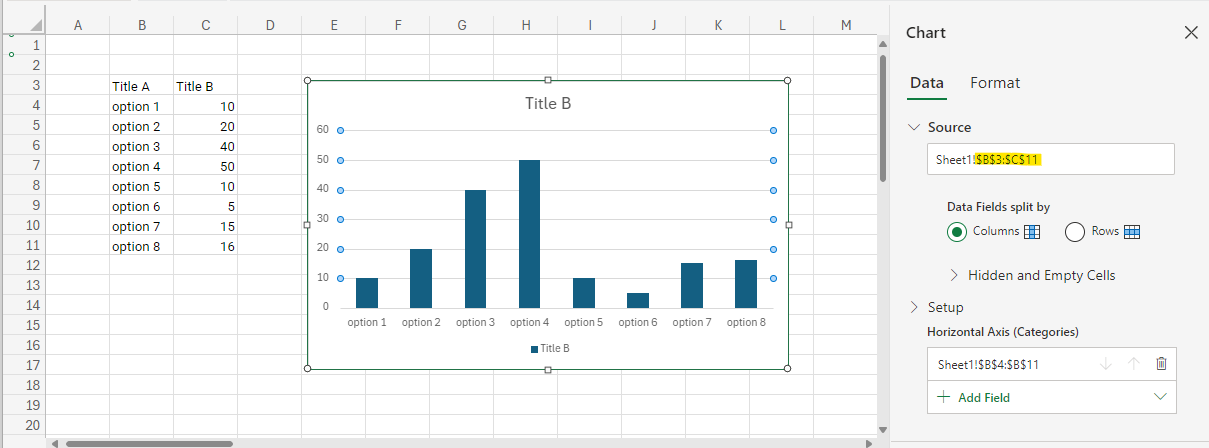
For example, please refer to the image below to see how MS Excel behaves when inserting a new row above the chart's data range.
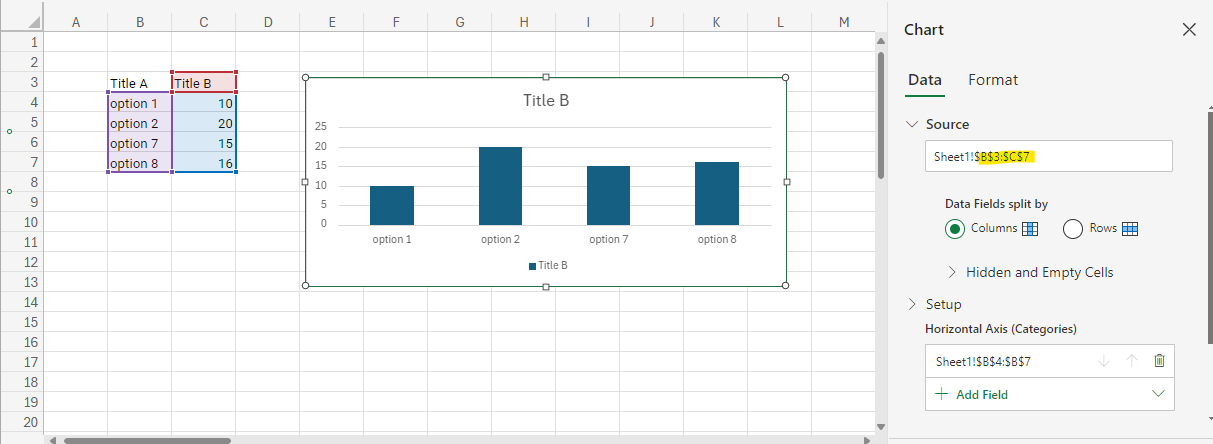
Please refer to the image below to see how MS Excel behaves when deleting some rows within the chart's data range.
 Bold BI
 Bold Reports
 BoldDesk