Welcome to the Flutter feedback portal. We’re happy you’re here! If you have feedback on how to improve the Flutter, we’d love to hear it!
Thanks for joining our community and helping improve Syncfusion products!
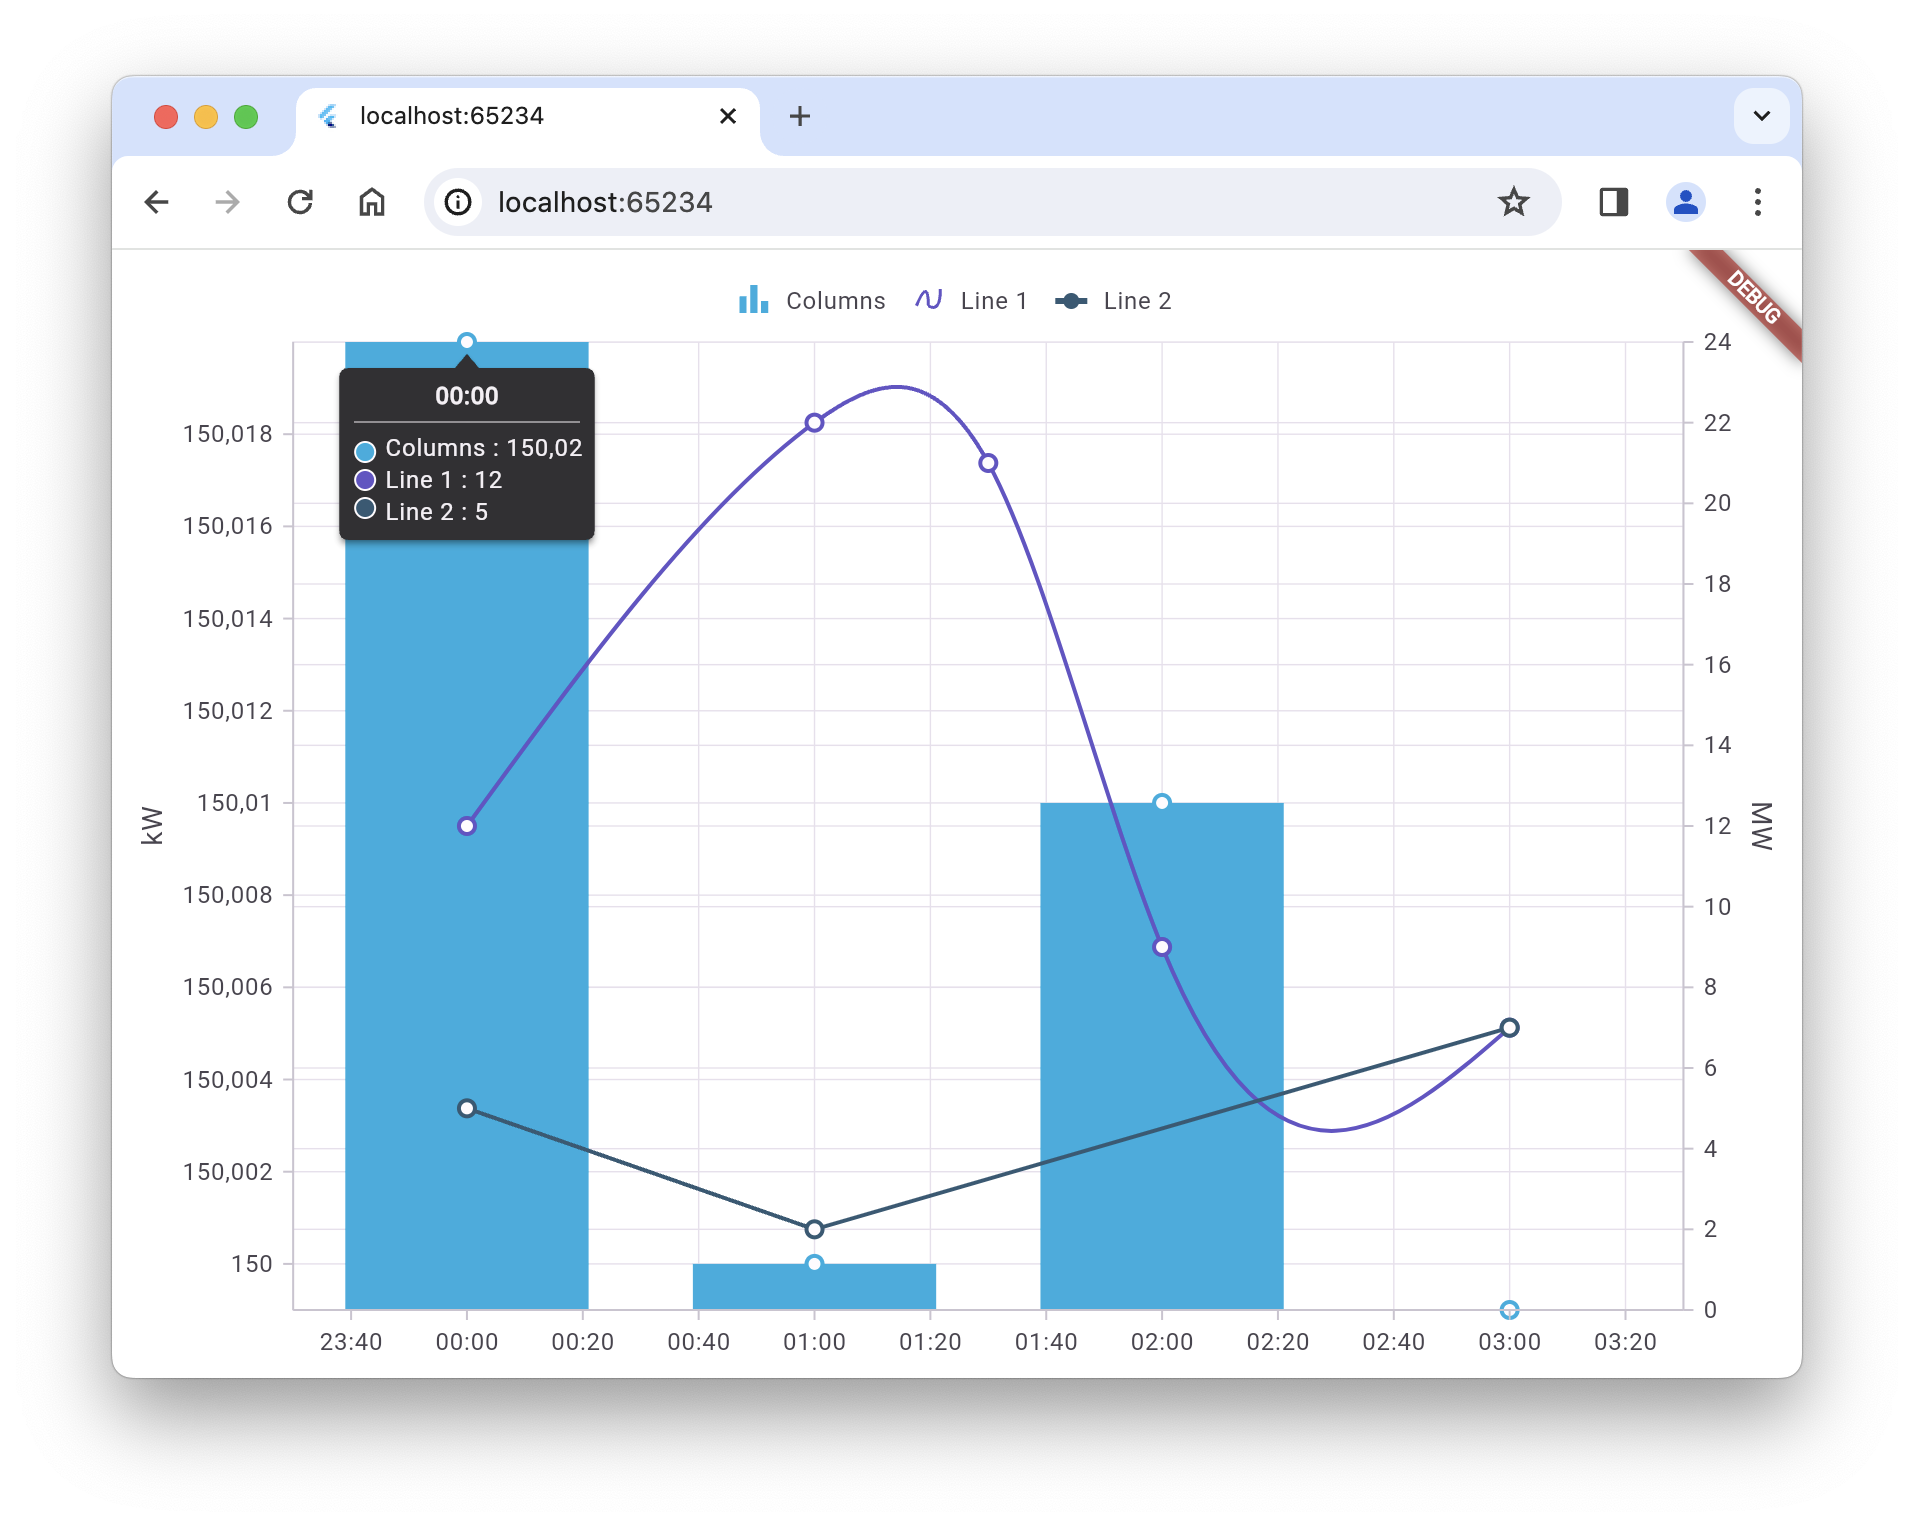
Ich have a chart with multiple series and "shared" activated for tootips. If one of the series misses 1 point, no more shared tooltips are displayed on the following points.
First point: all 3 values in tooltip
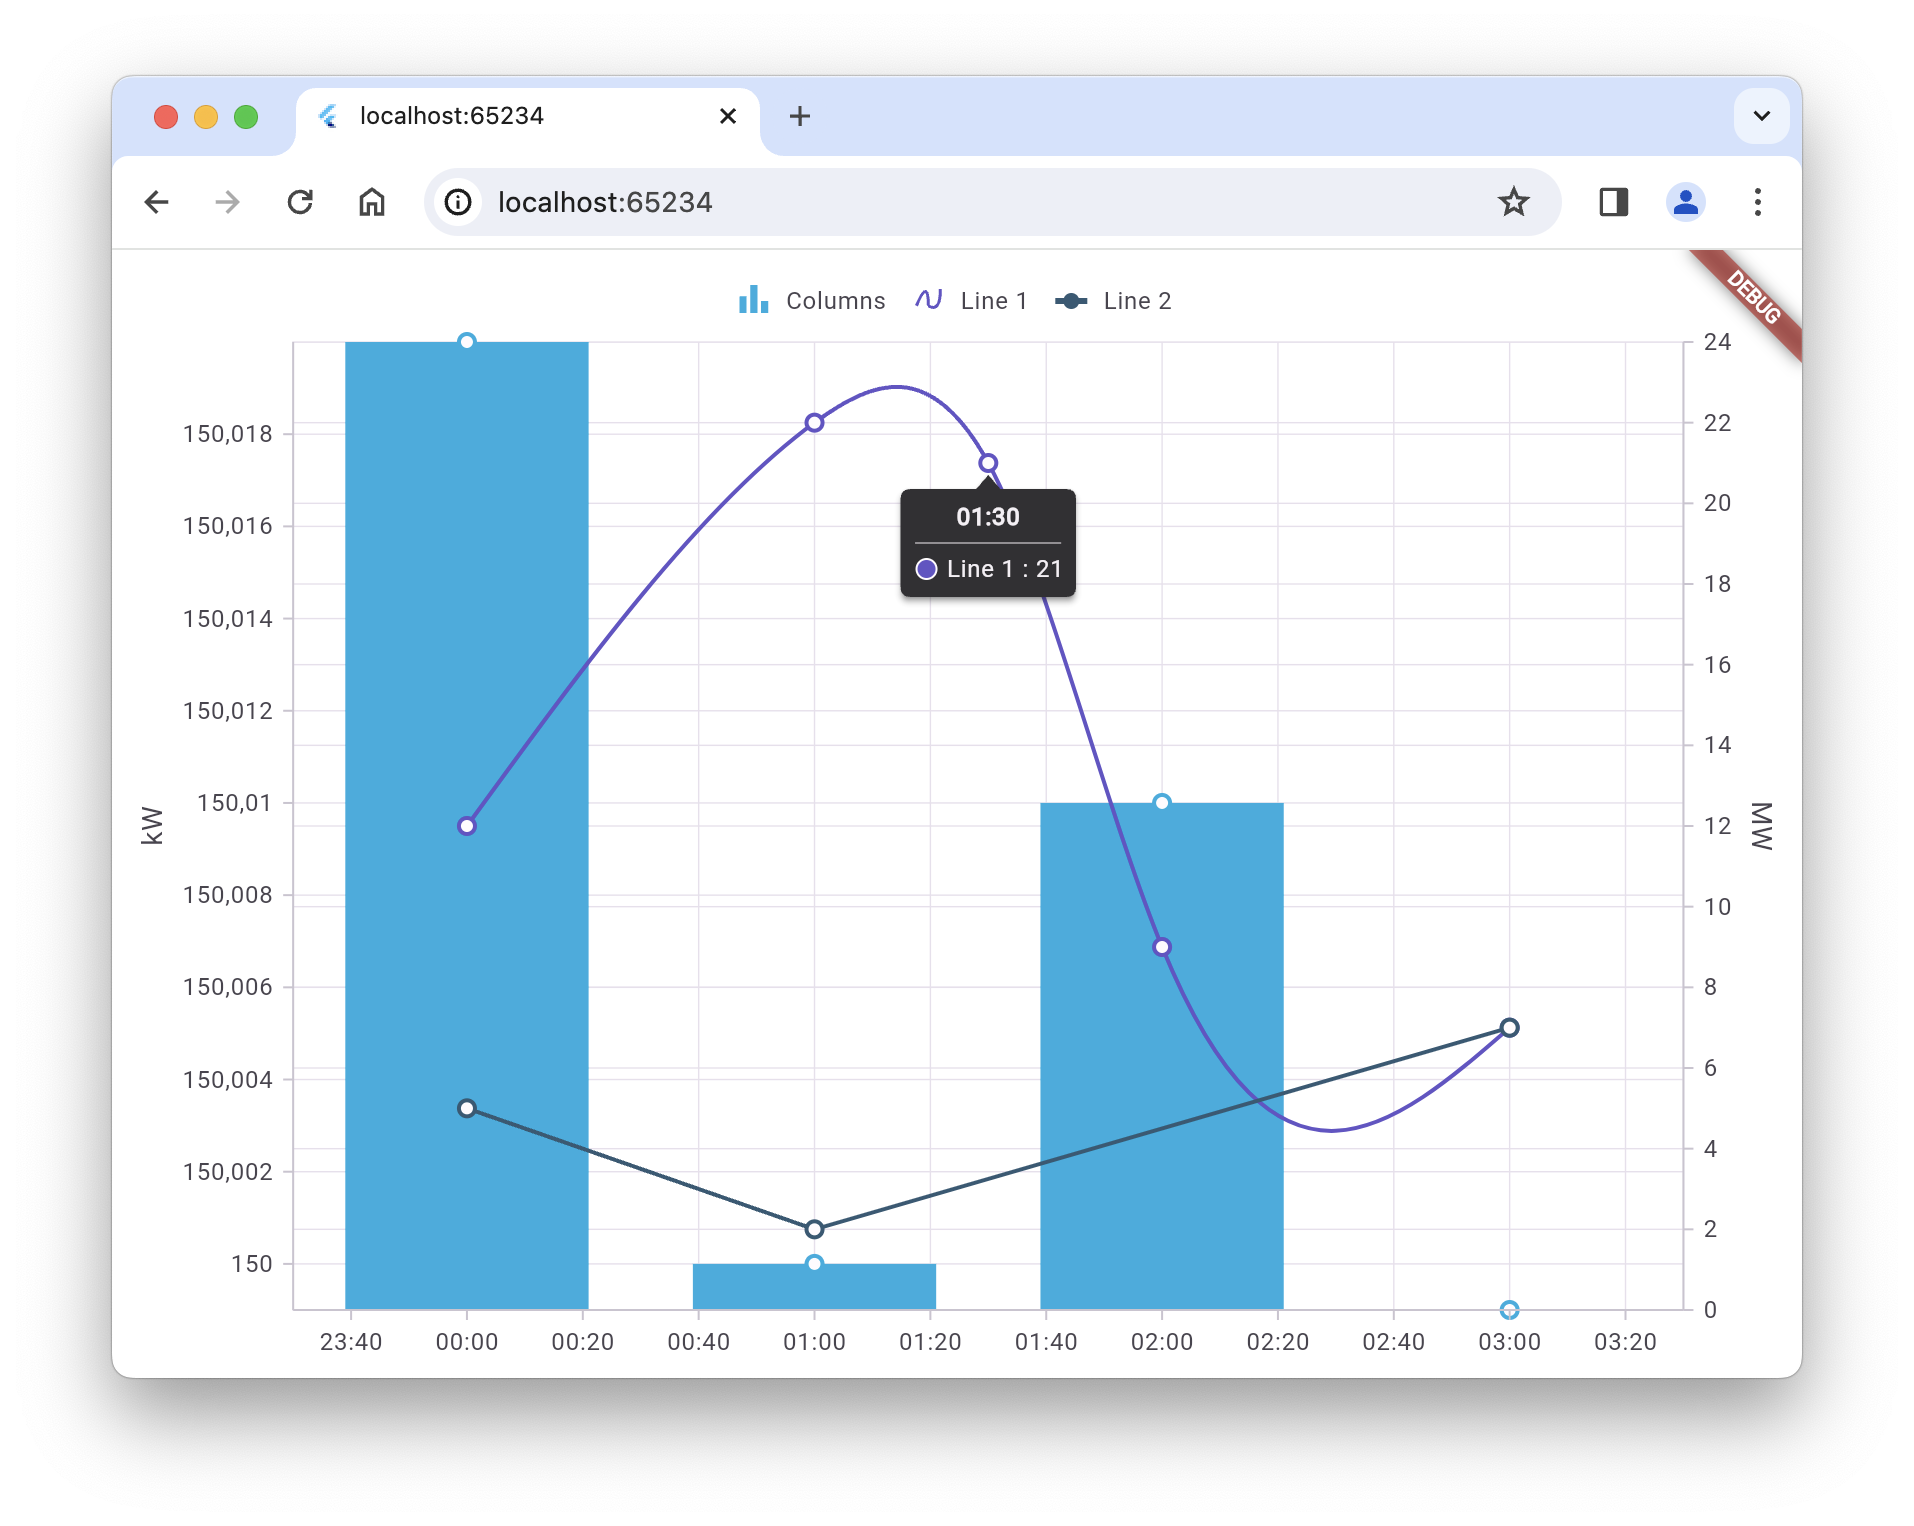
Third point: only 1 value (correct)
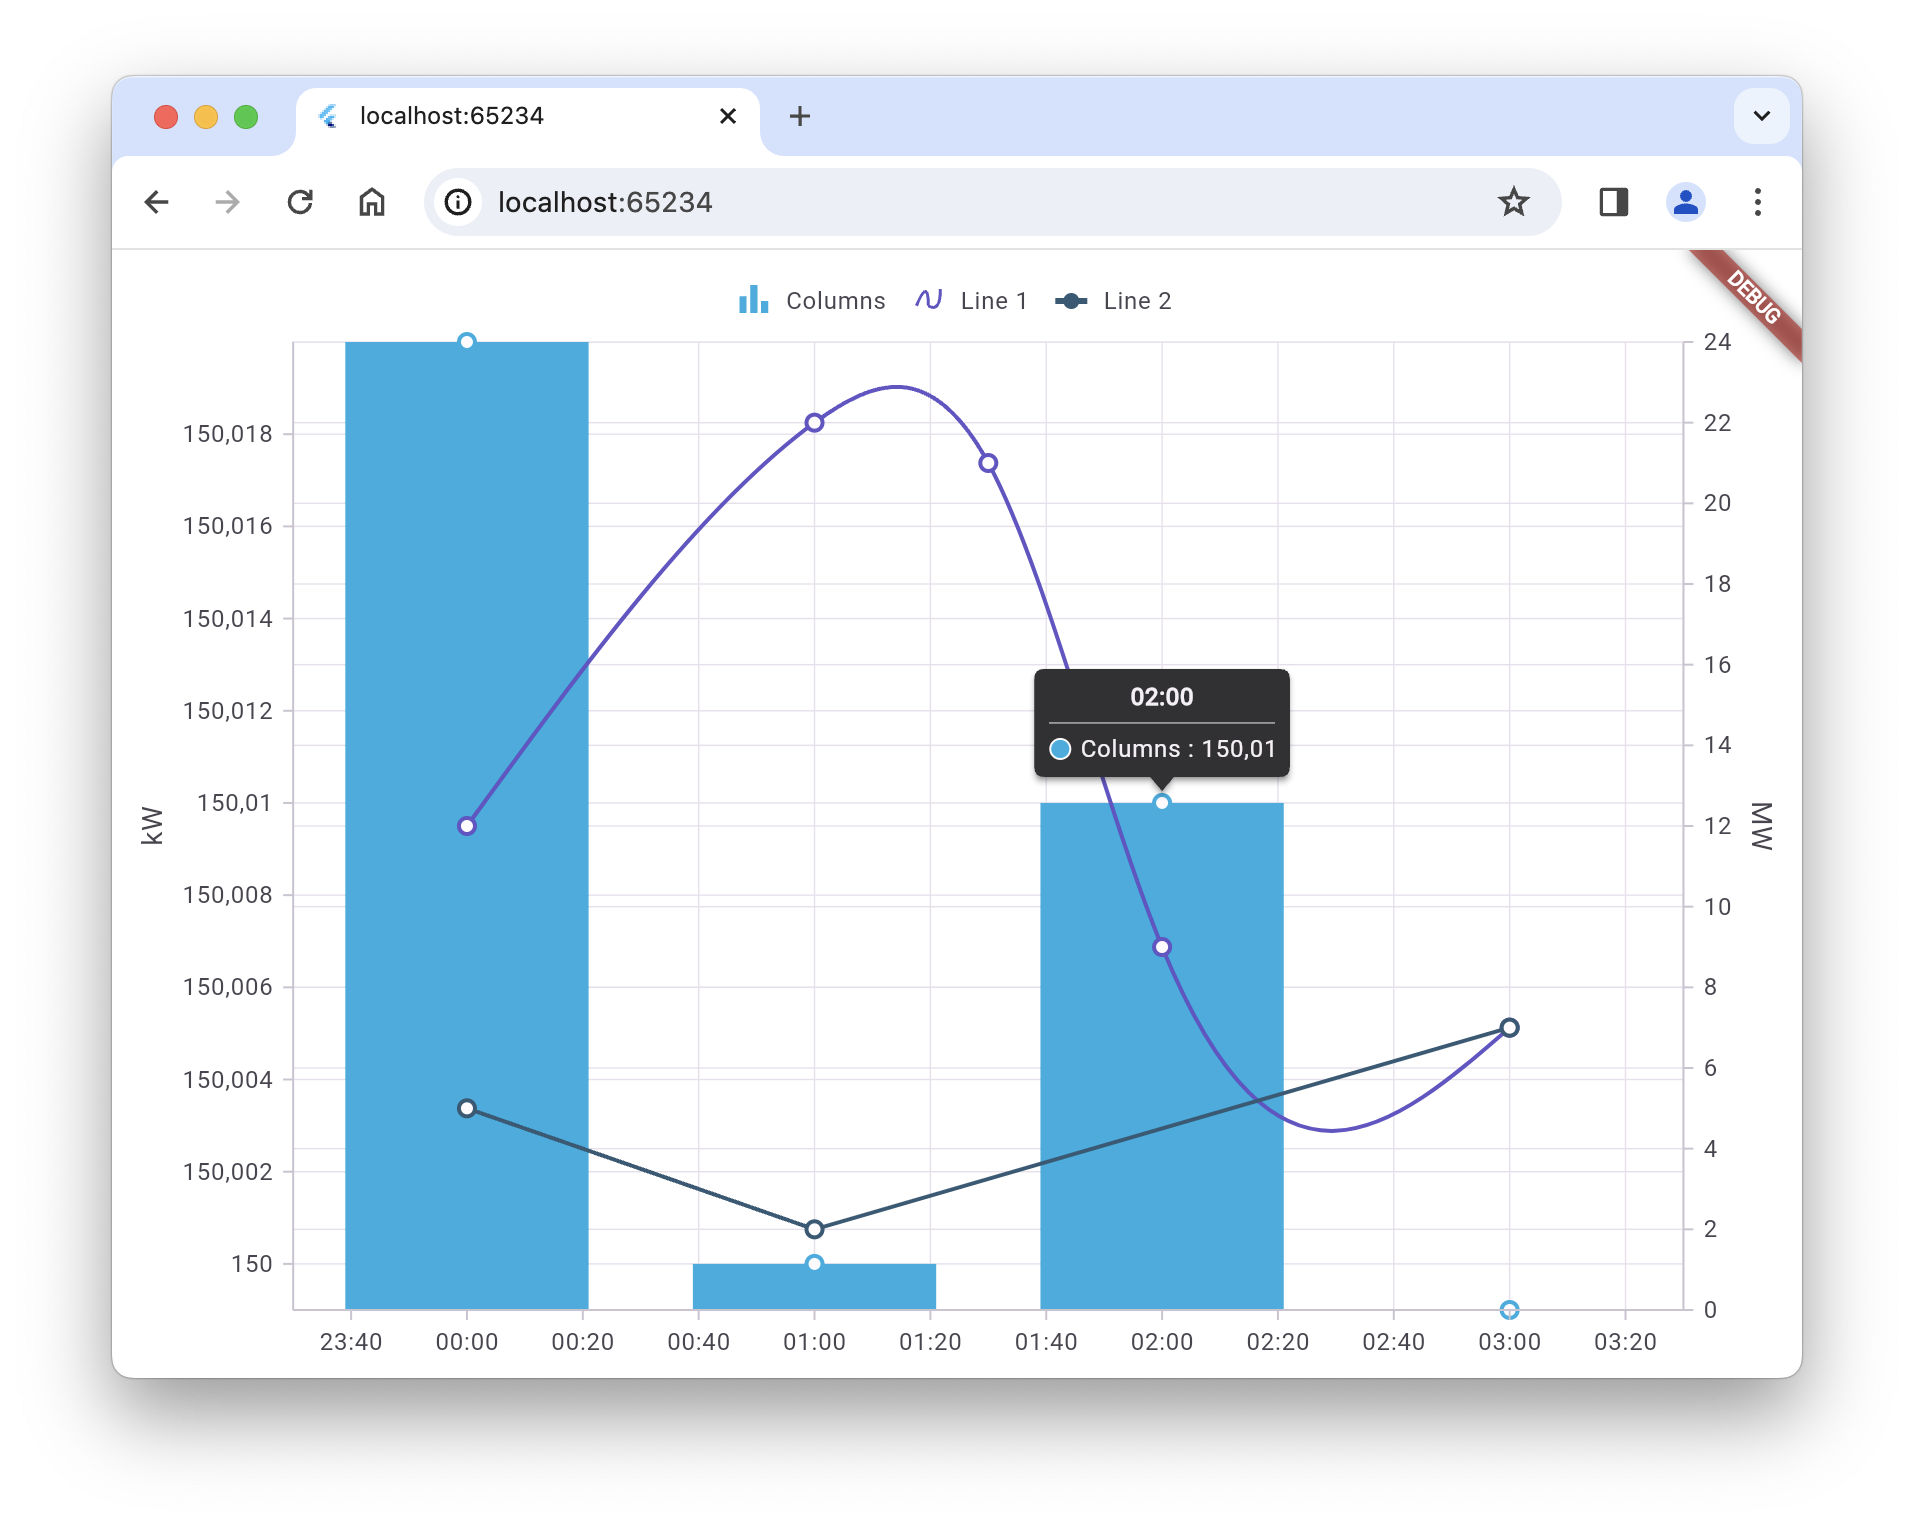
Fourth point: only 1 value (should be 2)
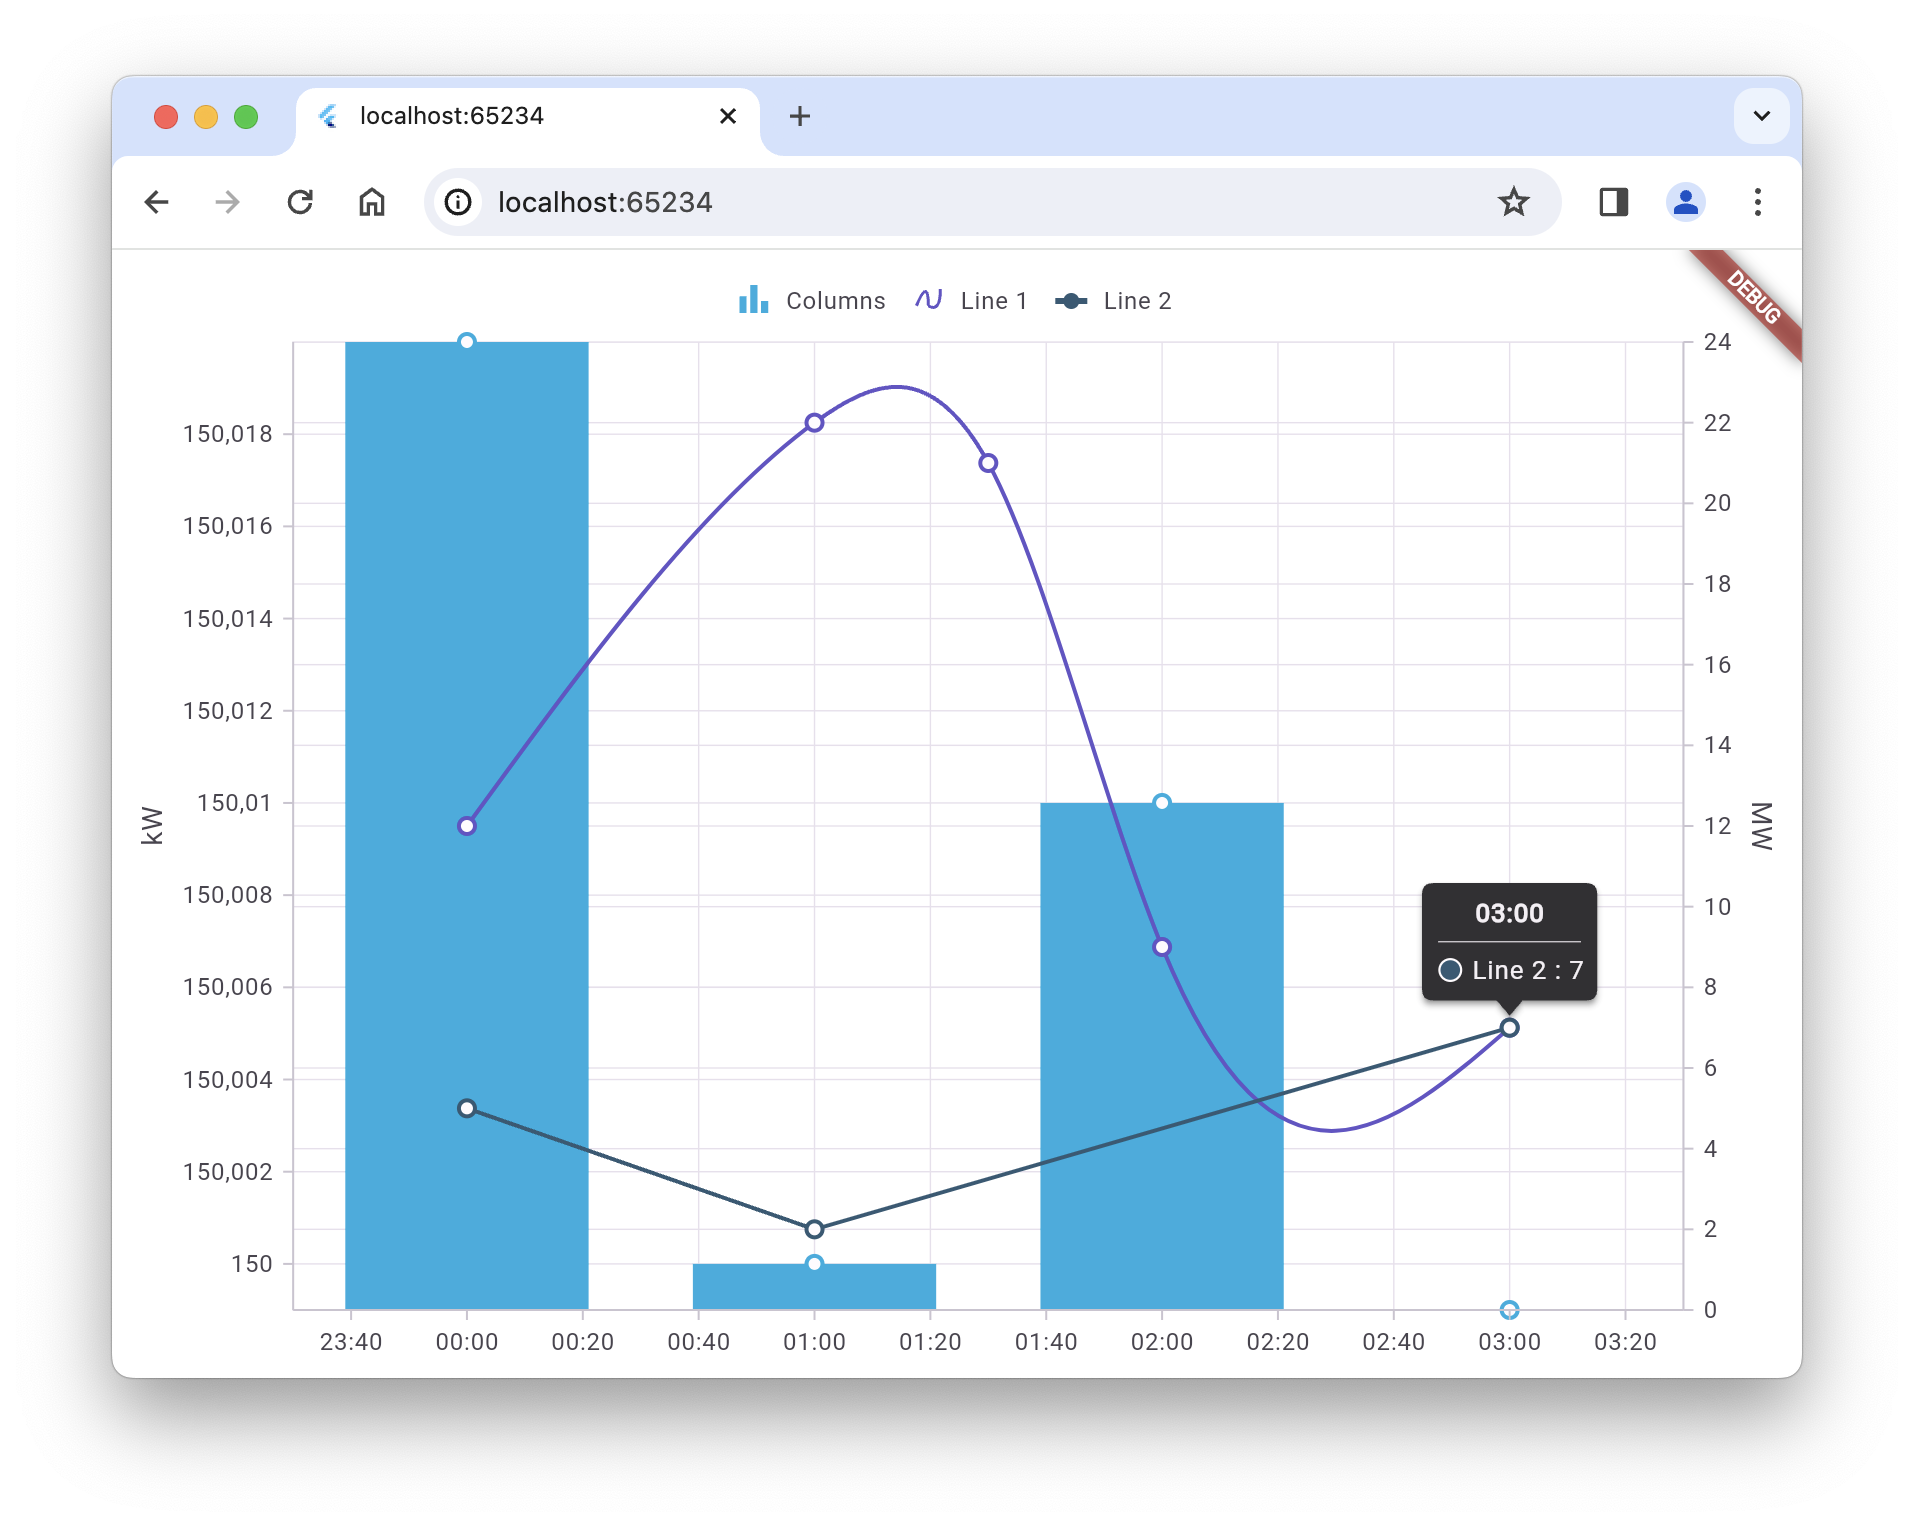
Fifth point: only 1 value (should be 3, no chance to see Line 1 in the tooltip)
import 'package:flutter/material.dart';
import 'package:intl/intl.dart';
import 'package:syncfusion_flutter_charts/charts.dart';

void main() {
  return runApp(_ChartApp());
}

class _ChartApp extends StatefulWidget {
  @override
  State<StatefulWidget> createState() {
    return _ChartAppState();
  }
}

class _ChartAppState extends State<_ChartApp> {
  ChartSeriesController? chartSeriesController;

  @override
  Widget build(BuildContext context) {
    final List<SalesData> chartData1 = [
      SalesData(DateTime(2024, 1, 1, 0), 150.02),
      SalesData(DateTime(2024, 1, 1, 1), 150),
      SalesData(DateTime(2024, 1, 1, 2), 150.01),
      SalesData(DateTime(2024, 1, 1, 3), 149.999),
    ];

    final List<SalesData> chartData2 = [
      SalesData(DateTime(2024, 1, 1, 0), 12),
      SalesData(DateTime(2024, 1, 1, 1), 22),
      SalesData(DateTime(2024, 1, 1, 1, 30), 21),
      SalesData(DateTime(2024, 1, 1, 2), 9),
      SalesData(DateTime(2024, 1, 1, 3), 7),
    ];

    final List<SalesData> chartData3 = [
      SalesData(DateTime(2024, 1, 1, 0), 5),
      SalesData(DateTime(2024, 1, 1, 1), 2),
      SalesData(DateTime(2024, 1, 1, 3), 7),
    ];

    return MaterialApp(
      home: SfCartesianChart(
        primaryXAxis: const DateTimeAxis(),
        primaryYAxis: NumericAxis(
          rangePadding: ChartRangePadding.none,
          //minimum: 0,
          title: const AxisTitle(text: "kW"),
          name: 'main',
          numberFormat: NumberFormat.decimalPattern('de_DE'),
        ),
        axes: const [
          NumericAxis(
            minimum: 0,
            title: AxisTitle(text: "MW"),
            name: 'axis2',
            opposedPosition: true,
            associatedAxisName: 'main',
          ),
        ],
        tooltipBehavior: TooltipBehavior(
          enable: true,
          shared: true,
          // format: ' series.name: point.y'
        ),
        legend: const Legend(isVisible: true, position: LegendPosition.top),
        series: <CartesianSeries>[
          // Renders line chart
          ColumnSeries<SalesData, DateTime>(
            name: 'Columns',
            yAxisName: 'main',
            animationDuration: 0,
            dataSource: chartData1,
            markerSettings: const MarkerSettings(isVisible: true),
            xValueMapper: (SalesData sales, _) => sales.year,
            yValueMapper: (SalesData sales, _) => sales.sales,
            // onRendererCreated: (controller) => chartSeriesController = controller,
          ),
          SplineSeries<SalesData, DateTime>(
            name: 'Line 1',
            yAxisName: 'axis2',
            animationDuration: 0,
            dataSource: chartData2,
            markerSettings: const MarkerSettings(isVisible: true),
            xValueMapper: (SalesData sales, _) => sales.year,
            yValueMapper: (SalesData sales, _) => sales.sales,
            // onRendererCreated: (controller) => chartSeriesController = controller,
          ),
          LineSeries<SalesData, DateTime>(
            name: 'Line 2',
            yAxisName: 'axis2',
            animationDuration: 0,
            dataSource: chartData3,
            markerSettings: const MarkerSettings(isVisible: true),
            xValueMapper: (SalesData sales, _) => sales.year,
            yValueMapper: (SalesData sales, _) => sales.sales,
            // onRendererCreated: (controller) => chartSeriesController = controller,
          ),
        ],
      ),
    );
  }
}

class SalesData {
  SalesData(this.year, this.sales);

  final DateTime year;
  final double sales;
}
 Bold BI
 Bold Reports
 BoldDesk