Welcome to the Angular feedback portal. We’re happy you’re here! If you have feedback on how to improve the Angular, we’d love to hear it!
Thanks for joining our community and helping improve Syncfusion products!
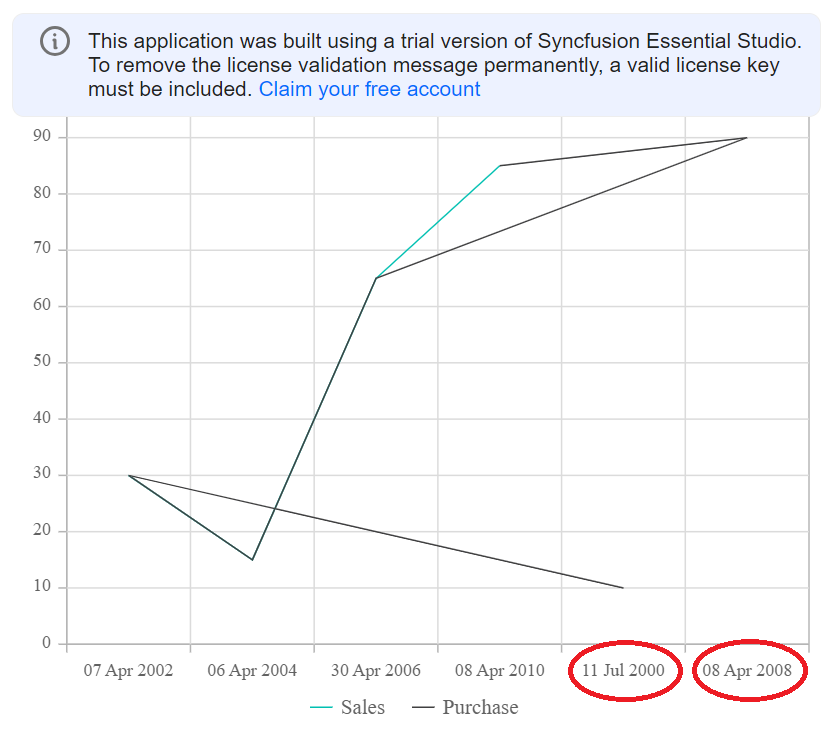
I have created a multi-series line chart. And I'm using the X-axis value type as DateTimeCategory.
And so I'm passing the X-axis value as a date object, not a string.
Once you run this sample you will see that some dates are rendering in the wrong place, and even the dates are sorted correctly. Due to this lines are rendering so wrong.
If we have taken an X-axis as DateTimeCategory then it should understand the dates and should render it at the correct place no?
can you please tell me if I'm doing something wrong? or how to solve this?
*You can hide the sales line and you will see purchase data line is wrong.
Big kudos to your team, for doing the best work!
 Bold BI
 Bold Reports
 BoldDesk