Welcome to the Blazor feedback portal. We’re happy you’re here! If you have feedback on how to improve the Blazor, we’d love to hear it!
Thanks for joining our community and helping improve Syncfusion products!
While setting the below properties, multiple Y axis will be framed based on the count of value fields bind in the report.
enableMultipleAxis as true and multipleAxisMode as Single.
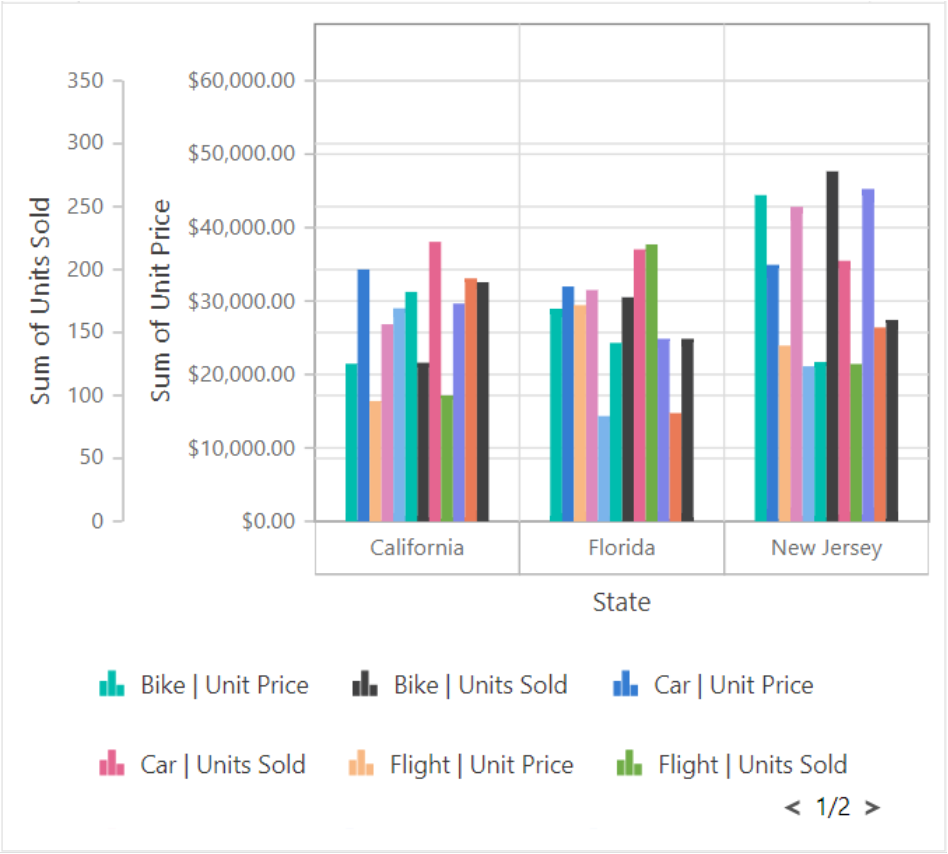
Also series of each values will be framed based on its scale range.
So, need to provide an option to plot the same chart series with a single Y axis. And the chart series should be framed based on the scale range of the Y axis.
 Bold BI
 Bold Reports
 BoldDesk